Code documentation
Module API
Module defining class Microstructure that contains the necessary methods and attributes to analyze experimental microstructures in form of EBSD maps to generate statistical descriptors for 3D microstructures, and to create synthetic RVE that fulfill the required statistical microstructure descriptors.
The methods of the class Microstructure for an API that can be used to generate Python workflows.
Authors: Alexander Hartmaier, Golsa Tolooei Eshlghi, Abhishek Biswas Institution: ICAMS, Ruhr University Bochum
- class kanapy.core.api.Microstructure(descriptor=None, file=None, name='Microstructure')[source]
Bases:
objectDefine a class for creating and managing synthetic microstructures
This class provides tools to define, generate, and analyze synthetic microstructures composed of one or multiple phases. It integrates particle packing, voxelization, and grain geometry generation for RVE (Representative Volume Element) modeling.
Parameters
- descriptorlist of dict, optional
List of dictionaries describing the microstructure of each phase. Dictionary keys typically include “Grains type”, “Equivalent diameter”, “Aspect ratio”, “Tilt Angle”, “RVE”, and “Simulation”.
- filestr, optional
Path to a JSON or other input file to initialize the microstructure.
- namestr, default=’Microstructure’
Name of the microstructure
Attributes
- namestr
Name of the microstructure
- nphasesint or None
Number of phases in the microstructure
- ngrainsndarray or None
Array of grain counts in each phase
- nparticleslist or None
List of the number of particles in each phase
- descriptorlist of dict or None
Descriptor used to define microstructure if provided
- precipitfloat or None
Indicates the presence of precipitates, pores, or secondary particles in a continuous matrix. If float, specifies their volume fraction
- from_voxelsbool
True if the microstructure is imported from a voxel file
- particleslist or None
List of particle objects containing geometric information
- rveRVE_creator or None
Object containing RVE information including mesh dimensions, particle count, periodicity, and phase volume fractions
- simboxSimulation_Box or None
Object defining the geometric boundaries of the RVE simulation domain
- meshmesh_creator or None
Object storing voxelized mesh data including grain assignments, voxel connectivity, and smoothed node coordinates
- geometrydict or None
Dictionary of grain geometries. Keys may include “Vertices”, “Points”, “Simplices”, “Facets”, “Grains”, “GBnodes”, “GBarea”, “GBfaces”
- rve_statslist of dict or None
Statistical information for different RVE representations, including particles, voxels, and polyhedral grains
- rve_stats_labelslist of str or None
Labels corresponding to the types of RVEs analyzed, e.g., “Particles”, “Voxels”, “Grains”
- vf_voxndarray or None
Phase volume fractions obtained from voxelized structures
- ialloyint or None
Alloy identifier used for material library mapping
Notes
The class can initialize from either a statistical descriptor or a JSON data file
When only one phase is specified with a volume fraction < 1.0, a matrix phase is automatically added with a complementary fraction (1 - vf)
Kanapy is tested for up to two phases; using more may yield unpredictable results
- generate_data(user_metadata: Dict[str, Any] | None = None, boundary_condition: Dict[str, Any] | None = None, phases: Dict[str, Any] | List[Dict[str, Any]] | None = None, interactive: bool = True, structured: bool = True, ialloy: int = 1, length_unit: str = 'µm') dict[source]
Generate a JSON-compatible data schema containing user, system, and job-specific elements
This function builds a comprehensive data dictionary for a microstructure simulation, including metadata, boundary conditions, phase information, voxel and grain data. It supports interactive prompts for missing information, structured/unstructured meshes, and unit scaling.
Parameters
- user_metadatadict, optional
Prefilled metadata fields; required if interactive=False. Default is None.
- boundary_conditiondict, optional
Dictionary specifying mechanical or thermal boundary conditions. Default is None.
- phasesdict or list of dicts, optional
Phase-specific information; if None, default material library and ialloy are used.
- interactivebool, optional
If True, prompt user for missing information. Default is True.
- structuredbool, optional
Whether the mesh is structured. Default is True.
- ialloyint, optional
Alloy index for selecting material properties from the built-in library. Default is 1.
- length_unitstr, optional
Unit for length scaling; either ‘µm’ or ‘mm’. Default is ‘µm’.
Returns
- dict
A nested dictionary containing the complete data schema for the simulation.
Raises
- ValueError
If interactive=False and required metadata fields or boundary conditions are missing, or if length_unit is invalid
- TypeError
If phases is not a dict or a list of dicts when provided
- generate_grains()[source]
Calculate and store polyhedral grain geometry, including particle- and grain-diameter attributes, for statistical comparison
Notes
Requires self.mesh to be initialized by voxelize.
Updates self.geometry with polyhedral grain volumes and shared grain boundary (GB) areas.
If self.precipit is True, irregular grain 0 is temporarily removed from analysis.
Logs warnings if grains are not represented in the polyhedral geometry.
Prints volume fractions of each phase in the polyhedral geometry.
Parameters
None
Returns
- None
The calculated grain geometry is stored in self.geometry. Phase volume fractions are printed to the console.
Raises
- ValueError
If self.mesh or self.mesh.grains is None (i.e., voxelized microstructure not available).
- generate_orientations(data, ang=None, omega=None, Nbase=5000, hist=None, shared_area=None, iphase=None, verbose=False, **kwargs)[source]
Generate orientations for grains in a representative volume element (RVE) to achieve a desired crystallographic texture
This method assigns grain orientations to achieve a specified texture. The input can be an EBSDmap object or a string defining the type of orientation set (random or unimodal). For unimodal textures, ang and omega must be specified. Generated orientations are stored in self.mesh.grain_ori_dict, and self.mesh.texture is updated accordingly.
Parameters
- dataEBSDmap or str
Input source for orientations. Can be an EBSDmap object or a string specifying the type of orientation set: - ‘random’ or ‘rnd’ : generate a random orientation set - ‘unimodal’, ‘uni_mod’, or ‘uni_modal’ : generate a unimodal orientation set
- angfloat, optional
Orientation angle for unimodal texture (required if data is unimodal).
- omegafloat, optional
Kernel halfwidth for unimodal texture (required if data is unimodal).
- Nbaseint, default=5000
Number of base orientations used in random or unimodal generation.
- histarray_like, optional
Histogram for the grain orientations, used to weight orientations.
- shared_areaarray_like or float, optional
Shared grain boundary area for weighted orientation generation.
- iphaseint, optional
Phase index for which orientations are generated. If None, all phases are processed.
- verbosebool, default=False
If True, prints additional information during orientation generation.
Returns
- None
The generated orientations are stored in self.mesh.grain_ori_dict and self.mesh.texture is updated to reflect the type of generated texture.
Raises
- ValueError
If grain geometry is not defined (i.e., self.mesh.grains is None).
If data is unimodal but ang or omega are not provided.
If data is neither EBSDmap nor a recognized string option.
If histogram is provided but GB areas are not defined (and shared_area is None).
Examples
>>> # Generate random orientations for all grains
>>> rve.generate_orientations('random')
>>> # Generate unimodal orientations with specified angle and halfwidth
>>> rve.generate_orientations('unimodal', ang=30.0, omega=10.0)
>>> # Generate orientations for a specific phase with histogram weighting
>>> rve.generate_orientations('random', hist=hist_array, iphase=1)
>>> # Generate orientations using an EBSDmap object
>>> rve.generate_orientations(ebsd_map_obj)
- import_particles(file, path='./')[source]
Import particle data from a dump file
This function reads particle information from a specified dump file and stores it in the microstructure object, updating the simulation box and particle list.
Parameters
- filestr
Name of the input dump file containing particle data
- pathstr, optional
Directory path where the dump file is located. Default is current directory ‘./’
Returns
- None
Updates the object’s simbox and particles attributes
- init_RVE(descriptor=None, nsteps=1000)[source]
Initialize the Representative Volume Element (RVE) of the microstructure
This method creates the voxel- or particle-based RVE using the provided phase descriptor(s). It sets up the mesh dimensions, particle distribution, and simulation box geometry. The RVE object is constructed using the RVE_creator class, and key attributes such as nparticles and simbox are updated accordingly.
Parameters
- descriptorlist of dict, dict, or None, optional
Description of the microstructure phases. Each dictionary specifies parameters such as grain type, equivalent diameter, aspect ratio, and tilt angle. If None, the class attribute self.descriptor is used.
- nstepsint, optional
Number of optimization or relaxation steps for RVE generation. Default is 1000.
Notes
Assumes that RVE_creator and Simulation_Box are available and correctly configured.
If self.precipit is defined, an additional ‘Matrix’ phase is automatically added to preserve total volume fraction normalization.
Attributes Updated
- rveRVE_creator
The created RVE object containing voxel/particle information, size, periodicity, and phase volume fractions.
- nparticleslist
Number of particles per phase after RVE generation.
- simboxSimulation_Box
Object containing the geometric boundaries of the RVE domain.
- precipitfloat or None
If not None, a ‘Matrix’ phase is appended to rve.phase_names and its volume fraction is adjusted as (1.0 - precipit).
Returns
- None
Updates class attributes with the initialized RVE and simulation box.
- init_stats(descriptor=None, gs_data=None, ar_data=None, porous=False, save_files=False)[source]
Legacy function that redirects to plot_stats_init
This function is deprecated and serves as a wrapper for plot_stats_init. A warning is logged advising users to use plot_stats_init directly.
Parameters
- descriptorAny, optional
Descriptor data passed to plot_stats_init. Default is None.
- gs_dataAny, optional
Grain size data passed to plot_stats_init. Default is None.
- ar_dataAny, optional
Aspect ratio data passed to plot_stats_init. Default is None.
- porousbool, optional
Deprecated parameter, ignored. Default is False.
- save_filesbool, optional
Whether to save generated statistics files. Default is False.
Returns
- None
Calls plot_stats_init and does not return any value
- output_abq(nodes=None, name=None, voxel_dict=None, grain_dict=None, faces=None, dual_phase=False, thermal=False, units=None)[source]
Legacy function that redirects to write_abq
This function is deprecated and serves as a wrapper for write_abq. Warnings are logged advising users to use write_abq directly. The faces parameter is determined automatically if provided.
Parameters
- nodesarray-like, optional
Nodal coordinates to include in the output. Default is None.
- namestr, optional
File name for the Abaqus input file. Default is None.
- voxel_dictdict, optional
Voxel connectivity information. Default is None.
- grain_dictdict, optional
Grain-to-voxel mapping. Default is None.
- facesAny, optional
Deprecated parameter, automatically determined. Default is None.
- dual_phasebool, optional
Whether to include dual-phase data. Default is False.
- thermalbool, optional
Whether to include thermal data. Default is False.
- unitsdict, optional
Dictionary of units for the Abaqus model. Default is None.
Returns
- None
Calls write_abq and does not return any value
- output_ang(ori=None, cut='xy', data=None, plot=True, cs=None, pos=None, fname=None, matname='XXXX', save_files=True, dual_phase=False, save_plot=False)[source]
Convert microstructure orientations into a .ang file, optionally plotting a slice
This function generates a .ang file mimicking an EBSD map. If polygonalized microstructure is available, it will be used; otherwise, or if data=’voxels’, the voxelized microstructure will be exported. If no orientations are provided, each grain receives a random Euler angle. The function can also plot a 2D slice of the orientation map along a specified cutting plane.
Parameters
- oriarray-like of shape (self.Ngr, 3), optional
Euler angles of grains. If None, random angles are generated.
- cut{‘xy’, ‘xz’, ‘yz’}, optional
Plane along which to take a slice. Default is ‘xy’.
- data{‘voxels’, ‘poly’}, optional
Basis for generating the ANG file. Default is None, automatically selected.
- plotbool, optional
Whether to display a plot of the slice. Default is True.
- csstr, optional
Crystal symmetry. Default is None.
- posfloat or str, optional
Slice position as a numerical value or one of ‘top’, ‘bottom’, ‘left’, ‘right’. Default is None (uses top/right edge).
- fnamestr, optional
Filename for the output ANG file. Default is generated automatically.
- matnamestr, optional
Material name to write in the ANG file. Default is ‘XXXX’.
- save_filesbool, optional
Whether to save the ANG file. Default is True.
- dual_phasebool, optional
Whether to output dual-phase information. Default is False.
- save_plotbool, optional
Whether to save the plot as a PDF. Default is False.
Returns
- fnamestr
Name of the generated ANG file.
Raises
- ValueError
If pos is not a float or one of ‘top’, ‘bottom’, ‘left’, ‘right’.
If cut is not ‘xy’, ‘xz’, or ‘yz’.
If neither polygonal nor voxel microstructure is available.
Notes
Uses Delaunay triangulation to determine which grain each pixel belongs to when exporting polygons.
Slice plotting uses a colormap (default ‘prism’) and includes optional dual-phase coloring.
Examples
>>> # Export an XY slice with default settings
>>> fname = rve.output_ang(cut='xy')
>>> # Export a slice using voxel data and a specific Euler angles array
>>> fname = rve.output_ang(ori=euler_array, data='voxels', cut='xz', pos=10)
>>> # Plot and save the slice as PDF
>>> fname = rve.output_ang(save_plot=True)
- output_neper()[source]
Write particle position and weight files for Neper tessellation
This function generates two text files required for tessellation in Neper: - sphere_positions.txt containing the x, y, z coordinates of each particle - sphere_weights.txt containing the weight (radius) of each particle
The files are written in the current working directory. Each particle in self.particles is included in the output.
Raises
- ValueError
If self.particles is None, indicating that particles have not been packed yet.
Notes
Requires that particles are initialized via the pack() method.
The particle dictionary is built internally but not returned.
Examples
>>> # Write Neper input files for current particles
>>> rve.output_neper()
- pack(particle_data=None, k_rep=0.0, k_att=0.0, fill_factor=None, poly=None, save_files=False, verbose=False)[source]
Pack particles into the simulation box according to the RVE settings.
Parameters
- particle_dataarray-like or None, optional
Particle information. If None, uses self.rve.particle_data.
- k_repfloat, optional
Repulsion coefficient between particles. Default is 0.0.
- k_attfloat, optional
Attraction coefficient between particles. Default is 0.0.
- fill_factorfloat or None, optional
Fraction of simulation box to fill. Defaults to 1.0 if self.precipit is set.
- polyoptional
Additional packing options for polyhedral particles.
- save_filesbool, optional
If True, saves packed particle data to files.
- verbosebool, optional
If True, prints progress and warnings during packing.
Returns
- particleslist
List of packed particle objects with positions and geometrical information.
- simboxSimulation_Box
Updated simulation box reflecting particle packing.
Raises
- ValueError
If no particle data is available.
- AttributeError
If RVE or simulation box is not initialized before packing.
Notes
If self.precipit > 0.65, particle overlaps may occur. Requires self.rve and self.simbox to be initialized before calling.
- pckl(file=None, path='./')[source]
Write the microstructure into a pickle file
This function serializes the microstructure object using pickle, allowing complex structures to be stored and later reloaded.
Parameters
- filestr, optional
File name for the pickled microstructure. If None, the filename defaults to the microstructure name plus ‘.pckl’.
- pathstr, optional
Directory path to save the pickle file. Default is current directory ‘./’.
Returns
None
- plot_ellipsoids(cmap='prism', dual_phase=None, phases=False)[source]
Generate a 3D plot of particles in the RVE
This function visualizes ellipsoidal particles in the Representative Volume Element (RVE). Particles can be colored according to phase, and a custom colormap can be used. Note that dual_phase is deprecated; use phases instead.
Parameters
- cmapstr, optional
Colormap used for plotting particles. Default is ‘prism’.
- dual_phasebool or None, optional
Deprecated parameter for indicating dual-phase visualization. Use phases instead. Default is None.
- phasesbool, optional
If True, color particles according to their phase. Default is False.
Notes
Requires self.particles to be initialized by pack.
Automatically calculates aspect ratios of the RVE for proper 3D plotting.
Prints a warning if dual_phase is used and maps it to phases.
Returns
- None
Displays a 3D plot of ellipsoidal particles using plot_ellipsoids_3D.
Raises
- ValueError
If self.particles is None.
Examples
>>> # Simple 3D plot with default colormap
>>> rve.plot_ellipsoids()
>>> # Color particles according to phase
>>> rve.plot_ellipsoids(phases=True)
>>> # Use a custom colormap
>>> rve.plot_ellipsoids(cmap='viridis')
- plot_grains(geometry=None, cmap='prism', alpha=0.4, ec=None, dual_phase=None, phases=False)[source]
Plot the polygonalized microstructure of the RVE in 3D.
This function visualizes the polygonal (polyhedral) grain geometry of the microstructure, typically after generate_grains() has been executed. Users can customize the colormap, transparency, and edge color. It also supports coloring grains by phase.
Parameters
- geometrydict or None, optional
Dictionary containing the polygonal grain geometries. If None, uses self.geometry.
- cmapstr, optional
Matplotlib colormap name for rendering grain colors. Default is ‘prism’.
- alphafloat, optional
Transparency level of the grain surfaces (0 = fully transparent, 1 = fully opaque). Default is 0.4.
- eclist or None, optional
Edge color specified as an RGBA list, e.g. [0.5, 0.5, 0.5, 0.1]. Default is [0.5, 0.5, 0.5, 0.1].
- dual_phasebool or None, optional
Deprecated parameter for dual-phase coloring. Use phases instead. Default is None.
- phasesbool, optional
If True, color grains by phase rather than by grain ID. Default is False.
Notes
Requires polygonal grain data generated by generate_grains().
Automatically computes the aspect ratio of the RVE for correct 3D scaling.
Visualization is handled by plot_polygons_3D().
The parameter dual_phase is deprecated; prefer using phases instead.
Returns
- None
Displays a 3D plot of polygonal grains.
Raises
- ValueError
If no polygonal geometry is available (i.e., self.geometry is None).
Examples
>>> # Simple 3D plot of polygonal grains with default settings
>>> rve.plot_grains()
>>> # Color grains by phase
>>> rve.plot_grains(phases=True)
>>> # Use a custom colormap and set transparency
>>> rve.plot_grains(cmap='viridis', alpha=0.6)
>>> # Specify edge color
>>> rve.plot_grains(ec=[0.2, 0.2, 0.2, 0.3])
- plot_particles(cmap='prism', dual_phase=None, phases=False, plot_hull=True)[source]
Generate a 3D plot of particles in the RVE.
This function visualizes particles in the Representative Volume Element (RVE) in 3D. Particles can be colored according to phase, plotted with their convex hulls, and displayed using a custom colormap.
Parameters
- cmapstr, optional
Colormap used for plotting particles. Default is ‘prism’.
- dual_phasebool or None, optional
Deprecated parameter for indicating dual-phase visualization. Use phases instead. Default is None.
- phasesbool, optional
If True, color particles according to their phase. Default is False.
- plot_hullbool, optional
If True, plot the convex hull (inner polygon) of each particle. Default is True.
Notes
Requires self.particles to be initialized by pack.
Automatically calculates aspect ratios of the RVE for proper 3D plotting.
Prints a warning if dual_phase is used and maps it to phases.
Returns
- None
Displays a 3D plot of particles using plot_particles_3D.
Raises
- ValueError
If self.particles is None.
If particles do not have inner polygons.
Examples
>>> # Simple 3D plot with default colormap and convex hulls
>>> rve.plot_particles()
>>> # Color particles according to phase
>>> rve.plot_particles(phases=True)
>>> # Plot particles without convex hulls and use a custom colormap
>>> rve.plot_particles(cmap='viridis', plot_hull=False)
- plot_slice(cut='xy', data=None, pos=None, fname=None, dual_phase=False, save_files=False)[source]
Plot a 2D slice through the microstructure.
The function visualizes a cross-section of the microstructure. If a polygonalized microstructure is available, it will be used as the plotting basis; otherwise, or if data=’voxels’, the voxelized microstructure will be plotted. This method internally calls output_ang with plotting enabled and file writing disabled.
Parameters
- cutstr, optional
The cutting plane of the slice. Options are ‘xy’, ‘xz’, or ‘yz’. Default is ‘xy’.
- datastr, optional
Data basis for plotting. Options are ‘voxels’ or ‘poly’. Default is None.
- posstr or float, optional
Position of the slice, either as an absolute value or as one of ‘top’, ‘bottom’, ‘left’, ‘right’. Default is None.
- fnamestr, optional
Filename to save the figure as a PDF. Default is None.
- dual_phasebool, optional
If True, enable dual-phase visualization. Default is False.
- save_filesbool, optional
If True, the figure will be saved to disk. Default is False.
Returns
None
Examples
>>> micro.plot_slice(cut='xz', data='poly', pos='top', save_files=True)
- plot_stats(data=None, gs_data=None, gs_param=None, ar_data=None, ar_param=None, dual_phase=None, phases=False, save_files=False, show_all=False, verbose=False, silent=False, enhanced_plot=False)[source]
Plot particle, voxel, and grain diameter statistics for comparison
This method analyzes the microstructure at different representation levels (particles, voxels, and polyhedral grains) and plots corresponding statistical distributions. It can optionally handle multiphase materials, save plots, and display detailed information about geometric parameters.
Parameters
- datastr or None, optional
Specifies which type of data to analyze and plot: - ‘p’ : particles - ‘v’ : voxels - ‘g’ : grains If None, all available data types are analyzed.
- gs_datalist or array-like, optional
Grain size data for comparison with simulation results.
- gs_paramlist or array-like, optional
Parameters for fitting grain size distributions.
- ar_datalist or array-like, optional
Aspect ratio data for comparison with simulation results.
- ar_paramlist or array-like, optional
Parameters for fitting aspect ratio distributions.
- dual_phasebool or None, optional
Deprecated. Use phases instead.
- phasesbool, optional
If True, perform separate statistical analysis for each phase.
- save_filesbool, optional
If True, save generated plots and statistical results to files.
- show_allbool, optional
If True, display all generated plots interactively.
- verbosebool, optional
If True, print detailed numerical results during analysis.
- silentbool, optional
If True, suppresses console output and returns figures directly.
- enhanced_plotbool, optional
If True, use enhanced plot styling (automatically enabled when silent=True).
Returns
- flistlist of matplotlib.figure.Figure or None
List of generated figure objects if silent=True, otherwise None.
Raises
- None
This function does not raise exceptions if data is missing. Instead, it logs an error message and returns immediately.
Notes
Computes and compares geometric parameters such as principal axis lengths (a, b, c), aspect ratios, rotation axes, and equivalent diameters.
Results are stored in self.rve_stats and labeled in self.rve_stats_labels.
For multiphase structures, statistics are calculated per phase.
dual_phase is deprecated; prefer using phases.
Examples
>>> # Plot all statistics with default settings
>>> rve.plot_stats()
>>> # Plot only particle statistics and show all plots interactively
>>> rve.plot_stats(data='p', show_all=True)
>>> # Perform multiphase statistical analysis and save figures
>>> rve.plot_stats(phases=True, save_files=True)
>>> # Suppress console output and get figure objects
>>> figs = rve.plot_stats(silent=True)
- plot_stats_init(descriptor=None, gs_data=None, ar_data=None, porous=False, get_res=False, show_res=False, save_files=False, silent=False, return_descriptors=False)[source]
Plot initial statistical microstructure descriptors of RVE and optionally return computed descriptors
This method analyzes the initial microstructure defined by input descriptors (or the class attribute self.descriptor) and plots the distributions of equivalent diameters and aspect ratios. For elongated grains, it prints a summary of input and output statistics. Optionally, statistical descriptors can be returned for further processing.
Parameters
- descriptorlist of dict, dict, or None, optional
Microstructure phase descriptor(s). If None, uses self.descriptor.
- gs_datalist or array-like, optional
Grain size data for comparison with initial statistics.
- ar_datalist or array-like, optional
Aspect ratio data for comparison with initial statistics.
- porousbool, optional
If True, only the first phase is considered (e.g., for porous structures).
- get_resbool, optional
If True, computes statistical descriptors from the voxelized structure.
- show_resbool, optional
If True, prints detailed statistical results to the console.
- save_filesbool, optional
If True, saves generated plots to files.
- silentbool, optional
If True, suppresses console output and returns figures directly.
- return_descriptorsbool, optional
If True, returns computed statistical descriptors along with figures.
Returns
- flistlist of matplotlib.figure.Figure
List of generated figure objects.
- descslist of dict
Optional list of computed statistical descriptors if return_descriptors=True.
Notes
Requires voxelized microstructure (self.mesh) for computing descriptors.
Computes statistics for equivalent diameter, aspect ratio, principal axes, and rotation axes when applicable.
Can handle multiphase or single-phase microstructures.
Examples
>>> # Plot initial statistics with default settings
>>> rve.plot_stats_init()
>>> # Plot only the first phase (porous) and save figures
>>> rve.plot_stats_init(porous=True, save_files=True)
>>> # Compute descriptors and get figures and descriptor objects
>>> figs, descs = rve.plot_stats_init(get_res=True, return_descriptors=True)
>>> # Suppress console output and return figure objects
>>> figs = rve.plot_stats_init(silent=True)
- plot_voxels(sliced=False, dual_phase=None, phases=False, cmap='prism', ori=None, color_key=0, silent=False)[source]
Generate a 3D visualization of the voxelized RVE structure
This function visualizes the voxel-based microstructure of the RVE. It supports coloring by phase, grain ID, or crystallographic orientation, and can optionally render a sliced view of the 3D voxel mesh.
Parameters
- slicedbool, optional
If True, generates a sliced view of the voxel mesh to visualize the internal structure. Default is False.
- dual_phasebool or None, optional
Deprecated parameter for dual-phase visualization. Use phases instead. Default is None.
- phasesbool, optional
If True, color voxels by phase instead of grain ID. Default is False.
- cmapstr, optional
Name of the matplotlib colormap used for rendering. Default is ‘prism’.
- oriarray-like, bool, or None, optional
Array of grain orientations, or True to use self.mesh.grain_ori_dict for coloring via inverse pole figure (IPF) mapping. Default is None.
- color_keyint, optional
Selects the color mapping for orientations: - 0: iphHSVKey - 1: BungeColorKey - 2: ipfHKLKey Default is 0.
- silentbool, optional
If True, suppresses figure display and returns the matplotlib figure object instead. Default is False.
Returns
- figmatplotlib.figure.Figure or None
Returns the figure object if silent=True. Otherwise, displays the 3D plot and returns None.
Raises
- ValueError
If self.mesh.grains is None, indicating that voxelization has not been performed.
Notes
Requires that the voxel mesh (self.mesh) has been generated by voxelize().
If ori is provided, orientation-based coloring is applied using get_ipf_colors().
Prints a warning if dual_phase is used, since it is deprecated and replaced by phases.
Automatically computes aspect ratios of the RVE to ensure accurate 3D visualization.
Examples
>>> # Simple 3D plot of voxelized RVE
>>> rve.plot_voxels()
>>> # Plot a sliced view of the voxel mesh
>>> rve.plot_voxels(sliced=True)
>>> # Color voxels by phase and use a custom colormap
>>> rve.plot_voxels(phases=True, cmap='viridis')
>>> # Use orientation-based coloring via IPF mapping
>>> rve.plot_voxels(ori=True, color_key=2)
>>> # Suppress figure display and get the matplotlib Figure object
>>> fig = rve.plot_voxels(silent=True)
- smoothen(nodes_v=None, voxel_dict=None, grain_dict=None)[source]
Generate smoothed grain boundaries from a voxelated mesh.
Parameters
- nodes_varray-like or None, optional
Mesh node coordinates. If None, uses self.mesh.nodes.
- voxel_dictdict or None, optional
Dictionary of voxels in the mesh. If None, uses self.mesh.voxel_dict.
- grain_dictdict or None, optional
Dictionary mapping grains to their voxels. If None, uses self.mesh.grain_dict.
Returns
- None
The smoothed nodes are stored in self.mesh.nodes_smooth. Grain boundary faces are optionally stored in self.geometry[‘GBfaces’].
Raises
- ValueError
If nodes_v is None and self.mesh.nodes is not available.
- AttributeError
If self.mesh is not initialized before calling smoothen().
Notes
Requires self.mesh to be initialized by voxelize().
Updates self.mesh.nodes_smooth with smoothed node coordinates.
Adds ‘GBfaces’ entry to self.geometry if it exists.
- voxelize(particles=None, dim=None)[source]
Generate the RVE by assigning voxels to grains.
Parameters
- particleslist or None, optional
List of particle objects to voxelize. If None, uses self.particles.
- dimtuple of int, optional
3-tuple specifying the number of voxels in each spatial direction. If None, uses self.rve.dim.
Returns
- None
The voxelized mesh is stored in self.mesh. Phase voxel fractions are stored in self.vf_vox and printed to the console.
Raises
- ValueError
If particles is None and self.particles is not available.
If dim is not a 3-tuple when specified.
- AttributeError
If self.rve or self.simbox is not initialized before voxelization.
Notes
Requires self.particles to be initialized by pack().
Updates self.mesh, self.ngrains, self.Ngr, and self.vf_vox.
Logs warnings if phase volume fractions do not sum to 1.
Removes polyhedral grain geometries (self.geometry) after re-meshing to avoid inconsistencies.
- write_abq(nodes=None, file=None, path='./', voxel_dict=None, grain_dict=None, dual_phase=False, thermal=False, units=None, ialloy=None, nsdv=200, crystal_plasticity=False, phase_props=None, boundary_conditions: Dict[str, Any] | None = None)[source]
Write the Abaqus input deck (.inp) for the generated RVE
This method generates an Abaqus input file for the current RVE. It supports voxelized or smoothened meshes, dual-phase materials, crystal plasticity, thermal analysis, custom material properties, and optional boundary conditions. Material definitions and mesh data are automatically handled based on provided arguments or class attributes.
Parameters
- nodesstr or array-like, optional
Defines the mesh to write: - ‘voxels’, ‘v’ : use voxelized mesh - ‘smooth’, ‘s’ : use smoothened mesh - array-like : explicit nodal coordinates Default is None, automatically selecting available mesh.
- filestr, optional
Filename for the Abaqus input deck. Default is auto-generated.
- pathstr, optional
Directory path to save the input deck. Default is ‘./’.
- voxel_dictdict, optional
Dictionary with voxel information. Default is self.mesh.voxel_dict.
- grain_dictdict, optional
Dictionary mapping grain IDs to nodes. Default is self.mesh.grain_dict.
- dual_phasebool, optional
If True, generate input for dual-phase materials. Default is False.
- thermalbool, optional
If True, include thermal material definitions. Default is False.
- unitsstr, optional
Units for the model, ‘mm’ or ‘um’. Default is self.rve.units.
- ialloylist or object, optional
Material definitions for each phase. Default is self.rve.ialloy.
- nsdvint, optional
Number of state variables per integration point for crystal plasticity. Default is 200.
- crystal_plasticitybool, optional
If True, enable crystal plasticity material definitions. Default is False.
- phase_propsdict, optional
Additional phase-specific material properties.
- boundary_conditionsdict, optional
Dictionary specifying boundary conditions to write. Default is None.
Returns
- filestr
Full path to the generated Abaqus input file.
Raises
- ValueError
If no voxelized or smoothened mesh is available when required.
If invalid nodes argument is provided.
If units are not ‘mm’ or ‘um’.
If the list ialloy is longer than the number of phases in the RVE.
If periodic boundary conditions are requested but the RVE is non-periodic.
Notes
Automatically selects voxel or smoothened mesh if nodes is None.
Handles dual-phase structures and crystal plasticity input.
Writes additional material files if orientations are available and ialloy is provided.
Visualization or mesh generation must be performed before calling this function.
Examples
Write voxelized RVE input deck with default settings abq_file = rve.write_abq(nodes=’voxels’)
# Write smoothened RVE deck for dual-phase material abq_file = rve.write_abq(nodes=’smooth’, dual_phase=True, ialloy=alloy_list)
- write_abq_ori(ialloy=None, ori=None, file=None, path='./', nsdv=200)[source]
Write Abaqus material input file using grain orientations for crystal plasticity
This function generates an Abaqus .inp file containing material definitions for crystal plasticity, using the provided grain orientations and material IDs. If ialloy or ori are not specified, the method uses the RVE’s default values.
Parameters
- ialloylist or object, optional
Material identifiers for each phase. Default is self.rve.ialloy.
- oridict or array-like, optional
Dictionary or array of grain orientations. Default is self.mesh.grain_ori_dict.
- filestr, optional
Name of the output Abaqus material file. Default is auto-generated based on RVE name.
- pathstr, optional
Directory path where the file will be saved. Default is ‘./’.
- nsdvint, optional
Number of state variables per integration point for crystal plasticity. Default is 200.
Returns
- filestr
Full path to the generated Abaqus material input file.
Raises
- ValueError
If ialloy is not provided and self.rve.ialloy is None.
If ori is not provided and self.mesh.grain_ori_dict is None.
Notes
Calls writeAbaqusMat internally to generate the material definitions.
Assumes the RVE and grain orientations have been initialized prior to calling.
Examples
>>> # Write material file using default RVE orientations and material numbers
>>> abq_file = rve.write_abq_ori()
>>> # Specify custom material IDs and orientations
>>> abq_file = rve.write_abq_ori(ialloy=alloy_list, ori=ori_dict, file='custom_mat.inp')
- write_centers(file=None, path='./', grains=None)[source]
Write the center positions of grains to a CSV file
Parameters
- filestr, optional
Filename for the CSV file. Default is auto-generated based on self.name.
- pathstr, optional
Directory path to save the CSV file. Default is ‘./’.
- grainsdict, optional
Dictionary of grain data. Default is self.geometry[‘Grains’].
Returns
None
Notes
Each line in the CSV file corresponds to a grain center in the format: x, y, z.
Polyhedral grains without simplices are skipped.
- write_data(file: str | None = None, user_metadata: Dict[str, Any] | None = None, boundary_condition: Dict[str, Any] | None = None, phases: Dict[str, Any] | List[Dict[str, Any]] | None = None, interactive: bool = False, structured: bool = True, ialloy: int = 1, length_unit: str = 'µm')[source]
- write_ori(angles=None, file=None, path='./')[source]
Write grain orientations (Euler angles) to a CSV file
This method exports the orientations of grains in the microstructure. If no angles are provided, the method uses the stored grain orientations from the mesh. The CSV file contains one row per grain with three values representing the Euler angles (phi1, Phi, phi2).
Parameters
- anglesarray-like of shape (N, 3), optional
Euler angles for each grain. If None, the stored orientations are used.
- filestr, optional
Name of the output CSV file. If None, a default name based on the microstructure name and number of grains is used.
- pathstr, optional
Directory path where the CSV file will be saved. Default is ‘./’.
Returns
- str
Full path to the generated CSV file.
Raises
- ValueError
If angles is None and no grain orientations are stored in self.mesh.grain_ori_dict.
Notes
Each row in the CSV corresponds to one grain.
Values are written in the order: phi1, Phi, phi2 (in radians).
Examples
>>> # Export stored orientations to default file
>>> rve.write_ori()
>>> # Export provided orientations to a specific file
>>> rve.write_ori(angles=my_angles, file='grain_orientations.csv', path='./data')
- write_stl(data='grains', file=None, path='./', phases=False, phase_num=None)[source]
Export grains or particles as STL files representing convex polyhedra
This function writes STL files with triangular facets for grains or particles. Each facet is written in standard STL ASCII format:
``` solid name
- facet normal n1 n2 n3
- outer loop
vertex p1x p1y p1z vertex p2x p2y p2z vertex p3x p3y p3z
endloop
endfacet
Parameters
- data{‘grains’, ‘particles’}, optional
Determines whether to export grains or particles. Default is ‘grains’.
- filestr, optional
Filename for the STL file. Default is generated from self.name.
- pathstr, optional
Directory to save the STL file. Default is ‘./’.
- phasesbool, optional
If True, export only grains of a specific phase. Default is False.
- phase_numint, optional
Phase number to export if phases=True. Required in that case.
Returns
None
Raises
- ValueError
If phases=True but phase_num is not provided.
Notes
Facet normals are automatically computed using cross products of vertices.
Acute or irregular facets trigger warnings.
For particle export, each particle must have a valid inner polyhedron.
Examples
>>> # Export all grains to STL
>>> rve.write_stl()
>>> # Export particles to STL
>>> rve.write_stl(data='particles')
>>> # Export only phase 1 grains
>>> rve.write_stl(phases=True, phase_num=1)
- write_voxels(angles=None, script_name=None, file=None, path='./', mesh=True, source=None, system=False)[source]
Write voxel structure of the microstructure to a JSON file
This function exports the voxel-based representation of the microstructure, including grain numbers, optional orientations, and mesh data. Metadata such as owner, system information, and script name are included.
Parameters
- anglesnp.ndarray, optional
Array of Euler angles for grain orientations. If None, stored orientations are used if available. Default is None.
- script_namestr, optional
Name of the script used to generate the microstructure. Default is the current script file.
- filestr, optional
Name of the output JSON file. Default is based on microstructure name and number of grains.
- pathstr, optional
Directory path to save the JSON file. Default is current directory ‘./’.
- meshbool, optional
Whether to include mesh nodes and voxel connectivity in the output. Default is True.
- sourceAny, optional
Optional input or source information to include in the JSON metadata.
- systembool, optional
Whether to include system information in the JSON metadata. Default is False.
Returns
- None
The function writes a JSON file and does not return any value.
Module GUI
A Graphical User Interface for create_rve.py, cuboid_grains.py and cpnvert_ang2rve.py Created on May 2024 last Update Oct 2024 @author: Ronak Shoghi, Alexander Hartmaier
- kanapy.core.gui.add_label_and_entry(frame, row, label_text, entry_var, entry_type='entry', bold=False, options=None, col=0)[source]
Add a label and an input widget (entry, checkbox, or combobox) to a given frame
Parameters
- frametkinter.Frame
Parent frame where the widgets will be added
- rowint
Row index in the frame grid layout
- label_textstr or None
Text for the label; if None, no label is created
- entry_vartkinter variable
Variable bound to the input widget (e.g., StringVar, BooleanVar)
- entry_typestr, optional
Type of input widget: “entry”, “checkbox”, or “combobox” (default is “entry”)
- boldbool, optional
Whether to display the label text in bold (default is False)
- optionslist, optional
List of selectable options when entry_type is “combobox”
- colint, optional
Column index for placing the label and entry in the grid (default is 0)
Returns
- None
The function adds widgets directly to the frame
- class kanapy.core.gui.cuboid_rve(app, notebook)[source]
Bases:
objectClass for managing RVEs with cuboid grains and associated GUI controls
Parameters
- app: tk.Tk or tk.Frame
Reference to the main Tkinter application instance
- notebook: ttk.Notebook
Reference to the parent notebook widget for GUI tab placement
Attributes
- app: tk.Tk or tk.Frame
Reference to the main Tkinter application instance
- canvas: tk.Canvas
Canvas for displaying the cuboid RVE
- ms: object
Placeholder for the microstructure object
- texture_var2: tk.StringVar
Selected texture type (default “random”)
- matname_var2: tk.StringVar
Material name (default “Simulanium”)
- ialloy: tk.IntVar
Number of alloys (default 2)
- ngr_var: tk.StringVar
Number of grains in each direction (default “5, 5, 5”)
- nv_gr_var: tk.StringVar
Number of voxels per grain in each direction (default “3, 3, 3”)
- size_var2: tk.StringVar
RVE size in each direction (default “45, 45, 45”)
- kernel_var2: tk.StringVar
Kernel parameter for unimodal textures (default “-” or “7.5”)
- euler_var2: tk.StringVar
Euler angles for unimodal textures (default “-” or “0.0, 45.0, 0.0”)
Notes
The class handles creation, visualization, and parameter management for cuboid RVEs. GUI variable traces are used to automatically update dependent parameters such as kernel and Euler angle values based on the selected texture type.
- close()[source]
Quit and destroy the cuboid_rve GUI main window
Notes
This method terminates the Tkinter application and closes the main window
- create_cubes_and_plot()[source]
Create a microstructure object with cuboid grains and plot the RVE
Notes
Parses GUI parameters for number of grains, voxels per grain, and RVE size Initializes a Microstructure object and sets up the voxel mesh Assigns each cuboid grain an index and populates grain dictionaries Calls plot_voxels to generate the RVE figure and displays it on the GUI Returns nothing; updates the GUI canvas with the plotted RVE
- create_orientation()[source]
Create grain orientations for the cuboid RVE based on texture descriptors
Notes
Supports ‘unimodal’ textures with user-specified kernel and Euler angles Automatically generates the cuboid RVE if ms or ms.mesh is not initialized Calls generate_orientations to assign orientations to the microstructure Writes voxel data to a JSON file and plots the voxelized RVE with orientations Displays messages indicating progress and processing time
- display_cuboid(fig)[source]
Display the cuboid RVE figure on the GUI canvas
Parameters
- figmatplotlib.figure.Figure
The figure object representing the cuboid RVE to display
Notes
Destroys any existing canvas before displaying the new figure Updates the Tkinter window geometry to fit the figure
- export_abq()[source]
Export the cuboid RVE mesh to an Abaqus input file
Notes
Automatically generates the cuboid RVE without orientations if ms is not initialized Calls write_abq to export the mesh in millimeter units Displays a progress message if RVE generation is required
- update_euler_var(*args)[source]
Update the Euler angles variable based on the current texture selection
Parameters
- *argstuple
Optional arguments passed by the tkinter trace callback, not used directly
Notes
Sets euler_var2 to “0.0, 45.0, 0.0” if texture_var2 is ‘unimodal’, otherwise sets it to “-”
- kanapy.core.gui.parse_entry(entry)[source]
Convert a comma-separated string into a list of integers
Parameters
- entrystr
String of comma-separated integer values
Returns
- list of int
List of integers parsed from the input string
- class kanapy.core.gui.particle_rve(app, notebook)[source]
Bases:
objectClass for generating Representative Volume Elements (RVEs) based on particle simulations first tab
This class defines the GUI logic and default parameters for building RVEs using particle-based microstructure simulations. It manages various parameters such as particle size distribution, aspect ratio, texture settings, and periodic boundary conditions.
Parameters
- apptkinter.Tk or tkinter.Frame
Reference to the main Tkinter application instance.
- notebookttk.Notebook
The notebook widget in which this tab (RVE setup) is placed.
Attributes
- apptkinter.Tk or tkinter.Frame
Main application reference.
- msobject or None
Placeholder for microstructure data.
- ms_statsobject or None
Placeholder for microstructure statistical data.
- ebsdobject or None
Placeholder for EBSD data (if used).
- stats_canvas1tkinter.Canvas or None
Canvas for displaying statistical plots.
- rve_canvas1tkinter.Canvas or None
Canvas for displaying the RVE visualization.
- texture_var1tk.StringVar
Texture type, default “random”.
- matname_var1tk.StringVar
Material name, default “Simulanium”.
- nphasestk.IntVar
Number of material phases, default 1.
- ialloytk.IntVar
Alloy type indicator, default 2.
- nvox_var1tk.IntVar
Number of voxels per dimension in the RVE, default 30.
- size_var1tk.IntVar
Physical size of the RVE, default 30.
- periodic_var1tk.BooleanVar
Whether to apply periodic boundary conditions, default True.
- volume_fractiontk.DoubleVar
Target total volume fraction, default 1.0.
- vf_acttk.DoubleVar
Actual volume fraction, initialized to 0.0.
- eq_diameter_sigtk.DoubleVar
Standard deviation of equivalent diameter distribution.
- eq_diameter_scaletk.DoubleVar
Scale parameter for equivalent diameter distribution.
- eq_diameter_loctk.DoubleVar
Location parameter for equivalent diameter distribution.
- eq_diameter_mintk.DoubleVar
Minimum equivalent diameter.
- eq_diameter_maxtk.DoubleVar
Maximum equivalent diameter.
- eqd_act_sigtk.DoubleVar
Active (fitted or adjusted) standard deviation for equivalent diameter.
- eqd_act_scaletk.DoubleVar
Active scale for equivalent diameter.
- eqd_act_loctk.DoubleVar
Active location for equivalent diameter.
- aspect_ratio_sigtk.DoubleVar
Standard deviation for aspect ratio distribution.
- aspect_ratio_scaletk.DoubleVar
Scale parameter for aspect ratio distribution.
- aspect_ratio_loctk.DoubleVar
Location parameter for aspect ratio distribution.
- aspect_ratio_mintk.DoubleVar
Minimum aspect ratio.
- aspect_ratio_maxtk.DoubleVar
Maximum aspect ratio.
- ar_act_sigtk.DoubleVar
Active standard deviation for aspect ratio.
- ar_act_scaletk.DoubleVar
Active scale for aspect ratio.
- ar_act_loctk.DoubleVar
Active location for aspect ratio.
- tilt_angle_kappatk.DoubleVar
Concentration parameter for tilt angle distribution.
- tilt_angle_loctk.DoubleVar
Mean (location) of tilt angle distribution in radians.
- tilt_angle_mintk.DoubleVar
Minimum tilt angle (0.0).
- tilt_angle_maxtk.DoubleVar
Maximum tilt angle (π).
- kernel_var1tk.StringVar
Orientation kernel width; depends on texture setting.
- euler_var1tk.StringVar
Euler angles defining the texture orientation; depends on texture setting.
- close()[source]
Quit and destroy the particle_rve GUI main window
Notes
This method quits the Tkinter application and destroys the main window
- create_and_plot_rve()[source]
Create the RVE from current statistics and plot it along with associated statistics
Notes
Will overwrite existing ms_stats and ms objects Displays a progress message and measures processing time Initializes self.ms with the selected material and voxelizes the RVE Plots the voxelized RVE using plot_voxels and displays it on the GUI Updates activity-related variables based on voxelized statistics Also plots statistics figures returned from plot_stats_init
- create_and_plot_stats()[source]
Plot statistics of the current microstructure descriptors and initialize a new Microstructure object
Notes
Will erase the global microstructure object self.ms if it exists Reads current statistics using readout_stats Initializes self.ms with the selected material and texture Plots statistics using plot_stats_init and displays each figure on the GUI Resets activity-related variables after plotting
- create_orientation()[source]
Generate grain orientations based on the selected texture and assign them to the RVE
Notes
Supports ‘unimodal’ textures with user-specified kernel and Euler angles, or ‘EBSD-ODF’ textures Automatically generates the RVE if ms_stats or ms objects are not initialized Calls generate_orientations to assign orientations to the microstructure Writes voxel data to a JSON file and plots the voxelized RVE with orientations Displays messages indicating progress and processing time
- display_plot(fig, plot_type)[source]
Show a statistics graph or RVE plot on the GUI canvas
Parameters
- figmatplotlib.figure.Figure
The figure object to be displayed
- plot_typestr
Type of plot to display, either ‘stats’ for statistics graph or ‘rve’ for RVE plot
Notes
Existing canvas for the specified plot type will be destroyed before displaying the new figure The GUI window size is updated to fit the new plot
- export_abq()[source]
Export the RVE mesh to an Abaqus input file
Notes
If ms_stats, ms, or ms.mesh is not initialized, the RVE is first generated without orientations Checks if the material is dual-phase based on volume fraction Calls write_abq to export the mesh in millimeter units Displays a progress message if RVE generation is required
- extract_microstructure_params()[source]
Extract microstructure parameters from the EBSD data and update GUI variables
Notes
If self.ebsd is None, the method does nothing Extracts grain size, aspect ratio, and orientation parameters from the first EBSD dataset Updates GUI variables for material name, volume fraction, equivalent diameter, aspect ratio, tilt angle, and texture type Computed min and max cutoff values are based on statistical scaling of the extracted parameters
- import_ebsd()[source]
Import an EBSD map and extract microstructure parameters
Notes
Opens a file dialog to select an EBSD map with extensions ‘.ctf’ or ‘.ang’ Displays messages indicating progress and success or failure Calls extract_microstructure_params and reset_act after successful import
- import_stats()[source]
Import statistical data from a JSON file and update GUI variables
Notes
Opens a file dialog to select a statistics file with ‘.json’ extension Updates GUI variables for material name, RVE size, voxel counts, periodicity, volume fraction, equivalent diameter, aspect ratio, and tilt angle based on imported data Calls reset_act and clears ebsd after successful import Displays a message indicating success or failure
- readout_stats()[source]
Collect and return the current microstructure and RVE statistics
Returns
- dict
A dictionary containing: - ‘Grain type’: Type of grain - ‘Equivalent diameter’: Distribution parameters (sig, scale, loc, cutoff_min, cutoff_max) - ‘Aspect ratio’: Distribution parameters (sig, scale, loc, cutoff_min, cutoff_max) - ‘Tilt angle’: Orientation parameters (kappa, loc, cutoff_min, cutoff_max) - ‘RVE’: RVE size and voxel counts - ‘Simulation’: Simulation settings including periodicity and output units - ‘Phase’: Material phase information including name, number, and volume fraction
- reset_act()[source]
Reset all activity-related variables to zero
Notes
Sets vf_act, eqd_act_sig, eqd_act_scale, ar_act_sig, and ar_act_scale to 0.0
- update_euler_var(*args)[source]
Update the Euler angles variable based on the current texture selection
Parameters
- *argstuple
Optional arguments passed by the tkinter trace callback, not used directly
Notes
If self.texture_var1 is ‘unimodal’, self.euler_var1 is set to “0.0, 45.0, 0.0” Otherwise, self.euler_var1 is set to “-”
- update_kernel_var(*args)[source]
Update the kernel variable based on the current texture selection
Parameters
- *argstuple
Optional arguments passed by the tkinter trace callback, not used directly
Notes
If self.texture_var1 is ‘unimodal’, self.kernel_var1 is set to “7.5” Otherwise, self.kernel_var1 is set to “-”
- kanapy.core.gui.self_closing_message(message, duration=4000)[source]
Display a temporary popup message box that closes automatically after a given duration
Parameters
- messagestr
The message text to display in the popup window
- durationint, optional
Time in milliseconds before the message box closes automatically (default is 4000)
Returns
- None
The function creates and destroys a popup window; no value is returned
Module CLI
- kanapy.core.cli.chkVersion(matlab)[source]
Read the installed MATLAB version from a version string
Parses the given MATLAB version string to extract the release year (e.g., ‘R2023a’ → 2023). If the version cannot be determined, returns None.
Parameters
- matlabstr
String containing MATLAB version information
Returns
- int or None
MATLAB release year if successfully parsed, otherwise None
- kanapy.core.cli.setPaths()[source]
Start the MATLAB engine and initialize the MTEX environment
Checks if the MATLAB engine for Python is installed and installs it if missing. Then initializes the MATLAB engine and MTEX toolbox for use with Kanapy.
Raises
- ModuleNotFoundError
If kanapy-mtex or MATLAB are not installed, or if the MATLAB engine installation fails
Notes
Requires MATLAB 2025a or later
Automatically installs the matlabengine package if not found
Configures Kanapy for texture analysis by running init_engine.py
Module initialization
Classes for RVE and mesh initialization
Authors: Mahesh Prassad, Abhishek Biswas, Alexander Hartmaier Ruhr University Bochum, Germany
March 2024
- class kanapy.core.initializations.NodeSets(nodes)[source]
Bases:
objectIdentify nodes on faces of a cuboidal mesh and store them in face-specific sets
Parameters
- nodesndarray
Array of nodal coordinates of shape (n_nodes, 3)
Attributes
- F0yz, F0yz_fulllist of int
Nodes on left face
- F1yz, F1yz_fulllist of int
Nodes on right face
- Fx0z, Fx0z_fulllist of int
Nodes on bottom face
- Fx1z, Fx1z_fulllist of int
Nodes on top face
- Fxy0, Fxy0_fulllist of int
Nodes on rear face
- Fxy1, Fxy1_fulllist of int
Nodes on front face
- surfSetlist of int
All nodes on any face
Notes
Uses np.isclose to identify nodes lying on the boundaries
Each *_full list keeps a copy of the original face node indices
surfSet includes all nodes belonging to any face
- CreatePeriodicEdgeSets(Nodes, sortCoord, NodeSet)[source]
Create a sorted list of nodes along an edge to facilitate periodic boundary conditions
Parameters
- Nodeslist of int
List of all node indices in the mesh
- sortCoordlist or ndarray
Coordinates of nodes along the sorting direction
- NodeSetlist of int
Node indices on the edge to be sorted
Returns
- sortedListlist of int
Node indices sorted according to sortCoord
- CreatePeriodicNodeSets(Nodes, sortCoord1, sortCoord2, NodeSet)[source]
Create a sorted list of nodes for a surface to facilitate periodic boundary conditions
Parameters
- Nodeslist of int
List of all node indices in the mesh
- sortCoord1list or ndarray
Coordinates of nodes along the first sorting direction
- sortCoord2list or ndarray
Coordinates of nodes along the second sorting direction
- NodeSetlist of int
Node indices on a surface to be sorted
Returns
- sortedListlist of int
Node indices sorted according to sortCoord1 and sortCoord2
- class kanapy.core.initializations.RVE_creator(stats_dicts, nsteps=1000, from_voxels=False, poly=None)[source]
Bases:
objectCreates an RVE based on user-defined statistics
Generates ellipsoid size distribution (Log-normal) based on user-defined statistics. Particle, RVE and simulation data are written as JSON files in a folder in the current working directory for later access.
Parameters
- stats_dictslist of dict
List of dictionaries containing microstructure descriptors for each phase
- nstepsint, optional
Maximum number of steps for packing simulation (default is 1000)
- from_voxelsbool, optional
If True, RVE is created from voxel input (default is False)
- polyobject, optional
Optional polygon object for particle generation
Attributes
- packing_stepsint
Max number of steps for packing simulation
- sizetuple of float
Side lengths of the RVE along Cartesian axes
- dimtuple of int
Number of voxels along Cartesian axes
- periodicbool
Whether the RVE is periodic
- unitsstr
Units of RVE dimensions, either “mm” or “um”
- nparticleslist of int
Number of particles for each phase
- particle_datalist of dict
Statistical particle data for each phase
- phase_nameslist of str
Names of phases
- phase_vflist of float
Volume fractions of each phase
- ialloylist of int
Alloy numbers for ICAMS CP-UMAT
Notes
Input parameters provided by the user in the input file are: - Standard deviation for ellipsoid equivalent diameter (Log-normal or Normal distribution) - Mean value of ellipsoid equivalent diameter (Log-normal or Normal distribution) - Minimum and Maximum cut-offs for ellipsoid equivalent diameters - Mean value for aspect ratio - Mean value for ellipsoid tilt angles (Normal distribution) - Side dimension of the RVE - Discretization along the RVE sides
Data written in output files include: - Ellipsoid attributes: Major, Minor, Equivalent diameters and tilt angle - RVE attributes: size, number of voxels, voxel resolution - Simulation attributes: periodicity and output unit scale (mm or μm) for ABAQUS .inp file
- class kanapy.core.initializations.mesh_creator(dim)[source]
Bases:
objectCreate a mesh object for voxel-based microstructure representation
Parameters
- dimtuple of int
3-tuple representing the number of voxels along each Cartesian direction
Attributes
- dimtuple of int
Dimension tuple: number of voxels in each Cartesian direction
- nvoxint
Total number of voxels
- phasesndarray
Field data storing phase numbers for each voxel
- grainsndarray
Field data storing grain numbers for each voxel
- voxel_dictdict
Dictionary mapping voxel number to associated nodes
- grain_dictdict
Dictionary mapping grain number to associated voxels
- grain_phase_dictdict
Dictionary storing phase per grain
- grain_ori_dictdict
Dictionary storing orientation per grain
- vox_center_dictdict
Dictionary storing center coordinates of each voxel
- nodesndarray
Array of nodal positions
- nodes_smoothndarray
Array of nodal positions after smoothing grain boundaries
- prec_vf_voxelsfloat
Actual volume fraction of precipitates in voxelated structure
Notes
Raises ValueError if dim is not a 3-tuple
Initializes data structures to store mesh, grains, phases, and nodes
voxel_dict is initialized as defaultdict(list) to store node lists per voxel
- create_voxels(sim_box)[source]
Generate voxels and nodes inside the defined RVE (simulation box)
Parameters
- sim_boxentities.Cuboid
Simulation box object representing the RVE dimensions
Returns
- None
Populates the mesh_creator object with: - nodes : ndarray
Array of nodal coordinates
- voxel_dictdict
Dictionary mapping voxel ID to list of node IDs
- vox_center_dictdict
Dictionary mapping voxel ID to center coordinates
Notes
Nodes are generated along Cartesian axes with spacing defined by dim
Voxel centers are computed as midpoint of voxel corners
8-node hexahedral (C3D8) element connectivity is maintained
Duplicate nodes are avoided using verticesDict
- get_ind(addr)[source]
Convert a voxel address to a flat array index
Parameters
- addrint or tuple of int
Address of the voxel. Can be a single integer index or a 3-tuple (i, j, k) representing voxel coordinates along each Cartesian axis
Returns
- indint or None
Flattened array index corresponding to the voxel address. Returns None if addr is None, returns addr unchanged if addr is an empty list
Notes
Assumes row-major ordering: index = i*dim[1]*dim[2] + j*dim[1] + k
Raises ValueError if addr is not a single integer or a 3-tuple
- kanapy.core.initializations.set_stats(grains, ar=None, omega=None, deq_min=None, deq_max=None, asp_min=None, asp_max=None, omega_min=None, omega_max=None, size=100, voxels=60, gtype='Elongated', rveunit='um', periodicity=False, VF=None, phasename=None, phasenum=None, save_file=False)[source]
Create a dictionary containing statistical grain and RVE information
Parameters
- grainslist of float
Parameters [sigma, loc, scale] of lognormal distribution for equivalent diameter
- arlist of float, optional
Parameters [sigma, loc, scale] of lognormal distribution for aspect ratio (required for Elongated grains)
- omegalist of float, optional
Parameters [kappa, loc] of von Mises distribution for tilt angle (required for Elongated grains)
- deq_min, deq_maxfloat, optional
Minimum and maximum cutoff for equivalent diameter
- asp_min, asp_maxfloat, optional
Minimum and maximum cutoff for aspect ratio
- omega_min, omega_maxfloat, optional
Minimum and maximum cutoff for tilt angle
- sizeint, optional
Side length of cubic RVE
- voxelsint, optional
Number of voxels per side of RVE
- gtypestr, optional
Grain type, either ‘Elongated’ or ‘Equiaxed’
- rveunitstr, optional
Unit of RVE dimensions (‘um’ or ‘mm’)
- periodicitybool or str, optional
Whether RVE is periodic
- VFfloat, optional
Volume fraction of phase
- phasenamestr, optional
Name of phase
- phasenumint, optional
Phase number
- save_filebool, optional
If True, save the dictionary as JSON
Returns
- ms_statsdict
Dictionary containing statistical grain data, RVE info, simulation settings, and phase info
Notes
Checks consistency of grain type and required parameters
Sets default cutoff values if not provided
Supports saving statistical info to JSON
- kanapy.core.initializations.stat_names(legacy=False)[source]
Return standardized names for statistical descriptors
Parameters
- legacybool, optional
If True, use legacy naming convention (‘std’, ‘offs’, ‘mean’, ‘kappa’); otherwise, use current naming convention (‘sig’, ‘loc’, ‘scale’, ‘kappa’).
Returns
- sigstr
Name for the standard deviation descriptor
- locstr
Name for the location descriptor
- scalestr
Name for the scale/mean descriptor
- kappastr
Name for the kappa/shape parameter
Module input_output
- kanapy.core.input_output.export2abaqus(nodes, file, grain_dict, voxel_dict, units: str = 'um', gb_area=None, dual_phase=False, thermal=False, ialloy=None, grain_phase_dict=None, crystal_plasticity=False, phase_props=None, boundary_conditions: Dict[str, Any] | None = None)[source]
Create an ABAQUS input file with microstructure morphology information including nodes, elements, and element sets
Parameters
- nodeslist
List of node objects or coordinates
- filestr
Output file path for the ABAQUS input file
- grain_dictdict
Dictionary containing grain information
- voxel_dictdict
Dictionary containing voxel-to-grain mapping
- unitsstr, optional
Units used in the input file (default is ‘um’)
- gb_areaoptional
Grain boundary area information
- dual_phasebool, optional
If True, element sets with phase numbers are defined and assigned to materials “PHASE_{phase_id}MAT” If False, each grain refers to a material “GRAIN_{grain_id}MAT”
- thermalbool, optional
If True, thermal properties are included
- ialloyoptional
Alloy information for grains, used if dual_phase is False
- grain_phase_dictdict, optional
Mapping from grain ID to phase ID
- crystal_plasticitybool, optional
If True, crystal plasticity data is included
- phase_propsoptional
Phase properties for crystal plasticity
- boundary_conditionsdict, optional
Dictionary defining boundary conditions, keys may include type, loading_direction, value, etc.
Notes
If dual_phase is False, a “_mat.inp” file with the same name is expected to define alloy number and Euler angles for each grain. Element sets are written for grains or phases depending on dual_phase. The function handles nodes, elements, sets, and optionally boundary conditions for ABAQUS simulations.
- kanapy.core.input_output.import_stats(file, path='./')[source]
Read microstructure statistical descriptors from a JSON file.
This function loads and parses a JSON file containing statistical information about a microstructure, such as RVE dimensions, phase fractions, or grain statistics.
Parameters
- filestr
Filename of the JSON file to read. The ‘.json’ extension will be appended automatically if missing.
- pathstr, optional
Directory path where the JSON file is located (default: ‘./’).
Returns
- descdict
Dictionary containing the statistical microstructure descriptors.
Raises
- ValueError
If file is None.
- FileNotFoundError
If the specified JSON file does not exist.
- json.JSONDecodeError
If the file cannot be parsed as valid JSON.
- OSError
If the file cannot be read due to permission or I/O errors.
Notes
The function expects the JSON file to contain key-value pairs describing microstructure statistics compatible with the output of
write_stats().
Examples
>>> desc = import_stats("example_stats.json")
>>> print(desc["RVE"]["Nx"])
20
- kanapy.core.input_output.import_voxels(file, path='./')[source]
Import a voxelized microstructure from a JSON file and reconstruct a Microstructure object for further analysis or simulation.
The voxel file typically contains: - Grain-wise orientation, phase, and shape information - Global model metadata (size, periodicity, phase names, etc.) - Optionally, mesh node coordinates and voxel connectivity
Parameters
- filestr
Filename of the voxelized microstructure JSON file to import.
- pathstr, optional
Path where the JSON file is located (default: ‘./’).
Returns
- msMicrostructure
Fully reconstructed microstructure object containing: - Grain geometry, phases, orientations - Voxel-level mesh and connectivity - Simulation box and RVE setup - Volume fractions and statistics
Raises
- ValueError
If file is None.
- FileNotFoundError
If the specified voxel file cannot be found.
- KeyError
If required keys (e.g. ‘Data’, ‘Model’) are missing in the JSON file.
- json.JSONDecodeError
If the file is not a valid JSON.
- RuntimeError
If the phase volume fractions do not sum to 1.0 (severe data inconsistency).
Notes
If grain_phase_dict or orientation information is missing, the function will fall back to single-phase mode and log warnings.
The mesh is either reconstructed from the JSON (if provided) or generated using mesh_creator().
Periodicity and unit information are retained from the model metadata.
Examples
>>> ms = import_voxels('example_vox.json', path='./input')
>>> print(ms.Ngr, 'grains loaded with', ms.nphases, 'phases.')
>>> print(ms.mesh.nodes.shape, 'mesh nodes')
- kanapy.core.input_output.pickle2microstructure(file, path='./')[source]
Load a pickled microstructure object from disk.
Parameters
- filestr
Filename of the pickled microstructure.
- pathstr, optional
Directory where the pickle file is stored (default: ‘./’).
Returns
- pclMaterial
Unpickled microstructure object.
Raises
- ValueError
If file is None.
- FileNotFoundError
If the specified pickle file does not exist.
- pickle.UnpicklingError
If the file cannot be unpickled (e.g., corrupted or invalid format).
- kanapy.core.input_output.read_dump(file)[source]
Read a .dump file to extract simulation box and ellipsoid information for voxelization
Parameters
- filestr
Path to the .dump file containing ellipsoid data generated in the packing routine
Returns
- sim_boxCuboid
Cuboid object representing the RVE (simulation box)
- Ellipsoidslist of Ellipsoid
List of ellipsoid objects representing the grains
Raises
- FileNotFoundError
If the specified .dump file does not exist
Notes
The function reads the simulation box dimensions and ellipsoid attributes including position, axes lengths, orientation, and phase number. Duplicate ellipsoids are identified based on naming convention in the dump file
- kanapy.core.input_output.writeAbaqusMat(ialloy, angles, file=None, path='./', grain_phase_dict=None, nsdv=200)[source]
Export Euler angles to Abaqus input deck that can be included in the _geom.inp file. If parameter “grain_phase_dict” is given, the phase number for each grain will be used to select the corresponding ialloy from a list. If the list ialloy is shorter than the number of phases in grain_phase_dict, no angles for phases with no corresponding ialloy will be written.
Parameters:
- ialloyint or list
Identifier, alloy number in ICAMS CP-UMAT: mod_alloys.f
- anglesdict or (N, 3)-ndarray
- Dict with Euler angles for each grain or array with number of N rows (= number of grains) and
three columns phi1, Phi, phi2
- filestr
Filename, optional (default: None)
- pathstr
Path to save file, option (default: ‘./’)
- grain_phase_dict: dict
Dict with phase for each grain, optional (default: None)
- nsdvint
Number of state dependant variables, optional (default: 200)
- kanapy.core.input_output.write_dump(Ellipsoids, sim_box)[source]
Write .dump files into a sub-directory “dump_files” for visualization or reuse in Kanapy
Parameters
- Ellipsoidslist
Contains information of ellipsoids such as positions, axes lengths, and tilt angles
- sim_boxCuboid
Contains information of the dimensions of the simulation box
Returns
None
Notes
The function creates a ‘dump_files’ directory in the current working directory if it does not exist and writes a file named ‘particle.<timestep>.dump’, where <timestep> is given by sim_box.sim_ts. The generated .dump files can be read by visualization software like OVITO or imported back into Kanapy to avoid repeating the packing simulation. Each file contains simulation domain bounds and ellipsoid attributes including position, axes lengths, and quaternion orientation.
- kanapy.core.input_output.write_stats(stats, file, path='./')[source]
Write microstructure statistical descriptors to a JSON file.
This function serializes the provided statistical data (e.g., phase fractions, grain sizes, RVE dimensions) and writes it to disk in JSON format. The .json extension is automatically appended if not provided.
Parameters
- statsdict
Dictionary containing statistical descriptors of the microstructure (e.g., grain count, phase fractions, RVE size, or any other metadata).
- filestr
Output filename for the JSON file. The ‘.json’ extension will be appended automatically if missing.
- pathstr, optional
Directory path where the JSON file will be written (default: ‘./’).
Raises
- ValueError
If stats or file is None.
- OSError
If the file cannot be written (e.g., due to permission or path issues).
- TypeError
If stats contains non-serializable objects (invalid for JSON encoding).
Notes
The function uses Python’s built-in
jsonmodule.The output file is overwritten if it already exists.
Examples
>>> stats = {"RVE": {"Nx": 20, "Ny": 20, "Nz": 20}, "Phase": {"Volume fraction": 0.8}}
>>> write_stats(stats, "example_stats")
# Writes './example_stats.json'
Module packing
- kanapy.core.packing.calculateForce(Ellipsoids, sim_box, periodicity, k_rep=0.0, k_att=0.0)[source]
Calculate the interaction forces between ellipsoids within the simulation box
Computes pairwise repulsive or attractive forces based on distance and phase between ellipsoids. Applies periodic boundary conditions if enabled.
Parameters
- Ellipsoidslist of Ellipsoid
List of ellipsoid instances for which forces are calculated
- sim_boxSimulation_Box
Simulation box representing the RVE dimensions
- periodicitybool
If True, applies periodic boundary conditions
- k_repfloat, optional
Repulsion factor for particles of the same phase (default is 0.0)
- k_attfloat, optional
Attraction factor for particles of different phases (default is 0.0)
- kanapy.core.packing.packingRoutine(particle_data, periodic, nsteps, sim_box, k_rep=0.0, k_att=0.0, fill_factor=None, poly=None, save_files=False, verbose=False)[source]
Perform particle packing routine using particle generation and growth simulation
The function first generates ellipsoids from the provided particle statistics and then grows them over time steps while handling collisions and interactions. Uses
particle_generator()to create particles andparticle_grow()to grow and settle them.Parameters
- particle_datalist of dict
Statistics describing particle attributes for generation
- periodicbool
Flag indicating if periodic boundary conditions are applied
- nstepsint
Total number of timesteps for the growth simulation
- sim_boxSimulation_Box
Simulation box representing the RVE dimensions
- k_repfloat, optional
Repulsion factor for same-phase particles (default 0.0)
- k_attfloat, optional
Attraction factor for different-phase particles (default 0.0)
- fill_factorfloat, optional
Target volume fraction for particle filling (default None, uses 0.65)
- polyndarray, optional
Points defining a primitive polygon inside ellipsoids (default None)
- save_filesbool, optional
Whether to save dump files during simulation (default False)
- verbosebool, optional
If True, prints detailed simulation output (default False)
Returns
- particleslist
List of generated and packed ellipsoids
- simboxSimulation_Box
Updated simulation box with current timestep information
Notes
Particle, RVE, and simulation data are read from JSON files generated by
kanapy.input_output.particleStatGenerator(). These files contain:Ellipsoid attributes such as Major, Minor, Equivalent diameters, and tilt angles
RVE attributes such as simulation domain size, number of voxels, and voxel resolution
Simulation attributes such as total number of timesteps and periodicity
- kanapy.core.packing.particle_generator(particle_data, sim_box, poly)[source]
Initialize a list of ellipsoids by assigning random positions, orientations, and sizes within the given simulation box.
Parameters
- particle_datadict
Dictionary containing ellipsoid properties such as major, minor, and equivalent diameters, tilt angles, and number of particles per phase.
- sim_boxentities.Simulation_Box
Simulation box object defining the representative volume element (RVE) dimensions (width, height, depth).
- polyndarray of shape (N, 3), optional
Points defining a primitive polygon inside the ellipsoid. Used for geometry construction.
Returns
- list
List of Ellipsoid objects initialized for the packing routine.
Notes
The function introduces a scaling factor (0.5) to reduce overlap among generated ellipsoids. Ellipsoids are assigned random colors and positions within the simulation box.
- kanapy.core.packing.particle_grow(sim_box, Ellipsoids, periodicity, nsteps, k_rep=0.0, k_att=0.0, fill_factor=None, dump=False, verbose=False)[source]
Perform recursive particle growth and collision detection within the simulation box. Initializes an
entities.Octreeinstance and progressively grows ellipsoids while handling inter-particle and wall collisions.Parameters
- sim_boxentities.Simulation_Box
Simulation box representing the representative volume element (RVE).
- Ellipsoidslist
List of Ellipsoid objects used in the packing routine.
- periodicitybool
Whether periodic boundary conditions are applied.
- nstepsint
Total number of simulation steps for filling the box with particles.
- k_repfloat, optional
Repulsion factor for particle interactions (default: 0.0).
- k_attfloat, optional
Attraction factor for particle interactions (default: 0.0).
- fill_factorfloat, optional
Target volume fraction for particle filling (default: 0.65).
- dumpbool, optional
If True, dump files for particles are written at intervals (default: False).
- verbosebool, optional
If True, print detailed information at iteration steps (default: False).
Returns
- Ellipsoidslist
Updated list of Ellipsoid objects after particle growth.
- sim_boxentities.Simulation_Box
Updated simulation box object after the packing process.
Notes
The function calls
kanapy.input_output.write_dump()at each time step to write .dump files. Periodic images are written by default but can be disabled inside that function.
Module entities
- class kanapy.core.entities.Cuboid(left, top, right, bottom, front, back)[source]
Bases:
objectCreate Cuboid objects for ellipsoids and Octree sub-branches
Parameters
- leftfloat
Bounding box minimum along x
- topfloat
Bounding box minimum along y
- rightfloat
Bounding box maximum along x
- bottomfloat
Bounding box maximum along y
- frontfloat
Bounding box minimum along z
- backfloat
Bounding box maximum along z
- class kanapy.core.entities.Ellipsoid(iden, x, y, z, a, b, c, quat, phasenum=0, dup=None, points=None)[source]
Bases:
objectCreates Ellipsoid objects for each ellipsoid generated from input statistics
Parameters
- idenint
ID of the ellipsoid
- xfloat
X-coordinate of the ellipsoid center
- yfloat
Y-coordinate of the ellipsoid center
- zfloat
Z-coordinate of the ellipsoid center
- afloat
Semi-major axis length of the ellipsoid
- bfloat
Semi-minor axis length of the ellipsoid
- cfloat
Semi-minor axis length of the ellipsoid
- quatnumpy.ndarray
Quaternion representing the ellipsoid’s orientation
- phasenumint, optional
Phase number of the ellipsoid, default is 0
- dupoptional
Duplicate status used for voxelization, default is None
- pointslist or None, optional
Points used to create a Delaunay tessellation for the ellipsoid, default is None
Attributes
- idint
ID of the ellipsoid
- x, y, zfloat
Position of the ellipsoid center
- xold, yold, zoldfloat
Previous positions
- a, b, cfloat
Semi-major and semi-minor axes lengths
- oria, orib, oricfloat
Original axes lengths
- speedx, speedy, speedzfloat
Velocity components, initialized to 0
- force_x, force_y, force_zfloat
Forces acting on the ellipsoid, initialized to 0
- rotation_matrixndarray
Rotation matrix of the ellipsoid
- surface_pointslist
Surface points of the ellipsoid
- inside_voxelslist
Voxels belonging to the ellipsoid
- duplicateoptional
Duplicate status used for voxelization
- phasenumint
Phase number
- brancheslist
Branches associated with the ellipsoid
- neighborlistset
Neighbor ellipsoids
- ncollisionint
Number of collisions
- inneroptional
Delaunay tessellation of points if provided, else None
Notes
The orientation of each ellipsoid in the global coordinate space is defined by its tilt angle and axis vector, expressed in quaternion notation.
Ellipsoids are initialized without a velocity; a random value is later assigned by kanapy.packing.particle_generator.
An empty list for storing voxels belonging to the ellipsoid is initialized.
- Bbox()[source]
Compute the axis-aligned bounding box of the ellipsoid using its surface points
Sets the attributes: - bbox_xmin, bbox_xmax - bbox_ymin, bbox_ymax - bbox_zmin, bbox_zmax
- create_poly(points)[source]
Create a polygon inside the ellipsoid
This method applies a rotation to the input points using the object’s rotation_matrix and computes the Delaunay triangulation to form a polygon
Parameters
- pointsarray_like
Input points to construct the polygon
Returns
- Delaunay
A Delaunay triangulation object representing the polygon
- get_coeffs()[source]
Return the semi-axes coefficients of the ellipsoid
Returns
- numpy.ndarray
A 1D array [a, b, c] representing the semi-major and semi-minor axes lengths of the ellipsoid.
- get_cub()[source]
Return the cuboid object of the ellipsoid
Returns
- Cuboid
Cuboid object representing the ellipsoid’s bounding cuboid
- get_pos()[source]
Return the current position of the ellipsoid
Returns
- numpy.ndarray
A 1D array [x, y, z] representing the current center coordinates of the ellipsoid.
- get_volume()[source]
Return the volume of the ellipsoid
Returns
- float
The volume of the ellipsoid calculated as (4/3) * pi * a * b * c.
- gravity_effect(value)[source]
Move the ellipsoid downwards to mimic the effect of gravity acting on it
Parameters
- valuefloat
User defined value for downward movement
Notes
The Cuboid object of the ellipsoid must be updated every time it moves
- growth(fac)[source]
Increase the size of the ellipsoid along its axes by a scaling factor
Parameters
- facfloat
Scaling factor applied to the original axes lengths.
- move(dt)[source]
Move the ellipsoid by updating its position vector using the Verlet integration method
This method updates the ellipsoid’s position and velocity components based on the current force and previous positions, and then updates the Cuboid object.
Parameters
- dtfloat
Time step used in the Verlet integration
Notes
The Cuboid object of the ellipsoid must be updated every time the ellipsoid moves
- rotationMatrixGen()[source]
Compute the rotation matrix of the ellipsoid from its quaternion
Returns
- numpy.ndarray
A 3x3 rotation matrix representing the ellipsoid’s orientation.
- set_cub()[source]
Initialize an object of the class Cuboid using the bounding box limits from Bbox
This method calls the Bbox method to obtain the bounding box limits and then creates a Cuboid object using these limits
- surfacePointsGen(nang=20)[source]
Generate points on the outer surface of the ellipsoid using its rotation matrix
Parameters
- nangint, optional
Number of points along each angular direction (default is 20).
Returns
- numpy.ndarray
An array of shape (nang*nang, 3) containing 3D coordinates of points on the ellipsoid surface.
- sync_poly(scale=None)[source]
Move the center of the polygon to the center of the ellipsoid and scale the hull to fit inside the ellipsoid
This method recenters the polygon points at the ellipsoid’s center, applies rotation and scaling to fit the polygon inside the ellipsoid, and updates the Delaunay triangulation.
Parameters
- scalefloat, optional
Scaling factor to apply to the polygon. If None, the default poly_scale from kanapy is used.
Notes
The function assumes that self.inner contains a Delaunay object representing the polygon. If self.inner is None, the method does nothing.
- wallCollision(sim_box, periodicity)[source]
Evaluate whether the ellipsoid collides with the boundaries of the simulation box
This method checks if the ellipsoid intersects with the simulation box walls. If periodicity is enabled, duplicates of the ellipsoid are created on opposite faces. If periodicity is disabled, the ellipsoid bounces back from the walls.
Parameters
- sim_boxSimulation_Box
Simulation box object containing boundary limits
- periodicitybool
Status of periodicity
Returns
- list
List of ellipsoid duplicates if periodicity is enabled, otherwise an empty list
Notes
The Cuboid object of the ellipsoid must be updated every time the ellipsoid moves
- class kanapy.core.entities.Octree(level, cub, particles=[])[source]
Bases:
objectCreate an Octree object for tree trunk and its sub-branches
Parameters
- level: int
Current level of the Octree, 0 for the trunk
- cub: Cuboid
Cuboid object of the tree trunk or sub-branches, should be entire simulation box for the trunk
- particles: list
List of particles within the tree trunk or sub-branches, contains all ellipsoids in the simulation domain for the trunk
Notes
level is set to zero for the trunk of the Octree
cub should be entire simulation box for the tree trunk
particles list contains all the ellipsoids in the simulation domain for the tree trunk
- add_particle(particle)[source]
Update the particle list of the Octree sub-branch
Parameters
- particle: object
Particle object to be added to the sub-branch
- collisionsTest()[source]
Test for collisions between all ellipsoids in the Octree sub-branch
Returns
- int
Number of collisions detected
Notes
Uses bounding sphere check as a preliminary filter and then calls the collision_routine to determine actual overlaps. Updates the collision count for each ellipsoid
- get_cub()[source]
Return the cuboid object of the octree sub-branch
Returns
- Cuboid
Cuboid object corresponding to the octree sub-branch
- make_neighborlist()[source]
Find the neighbor list for each particle in the Octree sub-branch
Notes
Initializes the neighborlist of each particle as a set and updates it with particles from all branches that the particle belongs to
- subdivide()[source]
Divide the Octree sub-branch into eight further sub-branches and initialize each as an Octree object
Notes
Each newly created sub-branch is appended to the branches list of the current Octree
- subdivide_particles()[source]
Evaluate which ellipsoids belong to each Octree sub-branch by checking intersections
Notes
Calls the intersect method of each sub-branch cuboid with each particle cuboid and adds the particle to the sub-branch if an intersection occurs
- update()[source]
Update the Octree and begin recursive subdivision or particle assignment
Notes
If the number of particles exceeds the maximum allowed and the current level is below the maximum, the sub-branch is subdivided and particles are distributed among the new branches. Otherwise, particles are associated with this branch
- class kanapy.core.entities.Simulation_Box(size)[source]
Bases:
objectRepresents a 3D simulation domain box
This class defines the simulation box dimensions and boundaries, and keeps track of the simulation time step.
Parameters
- sizetuple of float
Dimensions of the box as (width, height, depth).
Attributes
- wfloat
Width of the box.
- hfloat
Height of the box.
- dfloat
Depth of the box.
- sim_tsint
Current simulation time-step, initialized to 0.
- leftfloat
Position of the left boundary, initialized to 0.
- topfloat
Position of the top boundary, initialized to 0.
- frontfloat
Position of the front boundary, initialized to 0.
- rightfloat
Position of the right boundary, initialized to width.
- bottomfloat
Position of the bottom boundary, initialized to height.
- backfloat
Position of the back boundary, initialized to depth.
Module collisions
- kanapy.core.collisions.collide_detect(coef_i, coef_j, r_i, r_j, A_i, A_j)[source]
Determines overlap between two static ellipsoids using the Algebraic Separation Condition developed by W. Wang et al., 2001. This function implements the method for two ellipsoids with given coefficients, positions, and rotation matrices
Parameters
- coef_inumpy array
Coefficients of ellipsoid i
- coef_jnumpy array
Coefficients of ellipsoid j
- r_inumpy array
Position vector of ellipsoid i
- r_jnumpy array
Position vector of ellipsoid j
- A_inumpy array
Rotation matrix of ellipsoid i
- A_jnumpy array
Rotation matrix of ellipsoid j
Returns
- bool
True if ellipsoids i and j overlap, False otherwise
Notes
The method calculates the characteristic polynomial based on the ellipsoid coefficients and rigid body transformations. Roots of this polynomial are used with the Algebraic Separation Condition to determine whether the ellipsoids intersect. Real roots with negative values are analyzed to establish the overlap.
- kanapy.core.collisions.collision_react(ell1, ell2)[source]
Evaluates and modifies the magnitude and direction of the ellipsoid’s velocity after collision
Parameters
- ell1Ellipsoid
Ellipsoid i
- ell2Ellipsoid
Ellipsoid j
Notes
Consider two ellipsoids i, j at collision. Let them occupy certain positions in space defined by the position vectors r^i, r^j and have certain velocities represented by v^i, v^j respectively. The objective is to find the velocity vectors after collision. The elevation angle φ between the ellipsoids is determined by:
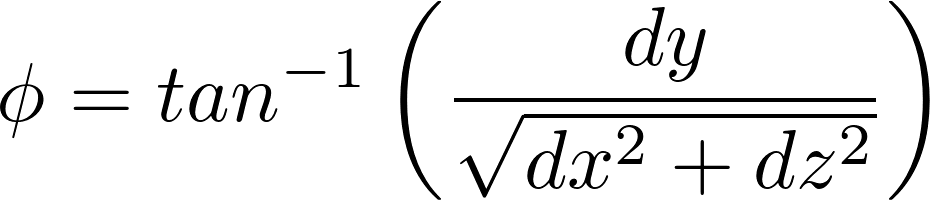
where dx, dy, dz are defined as the distance between the two ellipsoid centers along x, y, z directions given by:
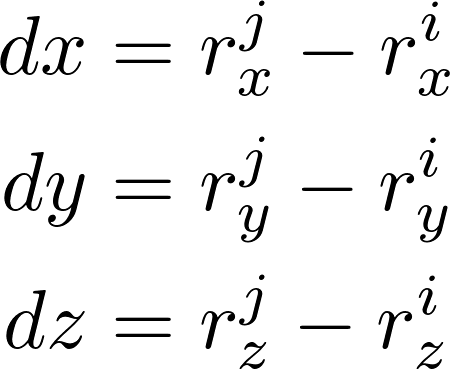
Depending on the magnitudes of dx, dz as projected on the x-z plane, the angle Θ is computed. The angles Θ and φ determine the in-plane and out-of-plane directions along which ellipsoid i would bounce back after collision. Thus, the updated velocity vector components along the x, y, z directions are determined by:
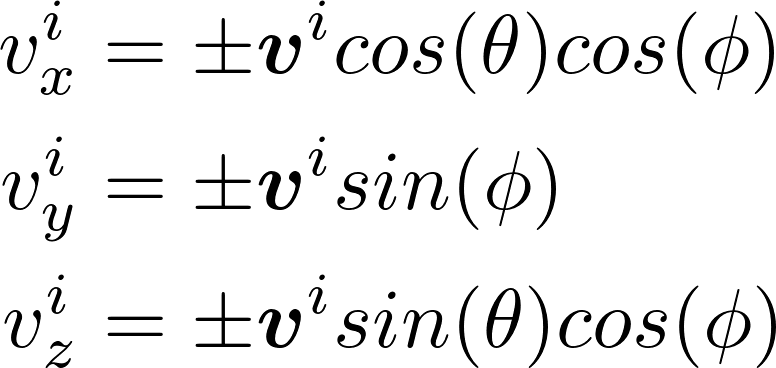
- kanapy.core.collisions.collision_routine(E1, E2)[source]
Detect and handle collision between two ellipsoid objects
Uses the algebraic separation condition by W. Wang et al. to detect overlap between two ellipsoids, and if a collision occurs, computes the contact response via the collision_react method.
Parameters
- E1Ellipsoid
First ellipsoid object (particle i)
- E2Ellipsoid
Second ellipsoid object (particle j)
Returns
- bool
True if overlap (collision) is detected, False otherwise
Notes
If both particles are spheres, the bounding sphere hierarchy alone suffices to detect collision.
If either particle is an ellipsoid, their coefficients, positions, and rotation matrices are used in the overlap test.
Module voxelization
- kanapy.core.voxelization.assign_voxels_to_ellipsoid(cooDict, Ellipsoids, voxel_dict, vf_target=None)[source]
Assign voxels to each ellipsoid based on spatial position and shared nodes
Iteratively grows each ellipsoid and assigns voxels whose centers lie within the ellipsoid’s convex hull. Voxels are additionally checked to share at least 4 nodes with existing voxels of the ellipsoid to ensure connectivity.
Parameters
- cooDictdict
Voxel dictionary containing voxel IDs as keys and center coordinates as values
- Ellipsoidslist
List of ellipsoid objects from the packing routine. Each object must support .a, .b, .c attributes and .surfacePointsGen() and .get_pos() methods
- voxel_dictdict
Element dictionary containing voxel IDs as keys and lists of nodal connectivity as values
- vf_targetfloat, optional
Target volume fraction of particles to be assigned (default is 1.0)
- kanapy.core.voxelization.points_in_convexHull(Points, hull)[source]
Determine whether the given array of points lie inside the convex hull
Checks if each point in Points is inside or outside the convex hull defined by hull. Returns a boolean array with True for points inside the hull and False otherwise.
Parameters
- Pointsndarray, shape (N_points, dim)
Array of points to be tested
- hullscipy.spatial.ConvexHull
Convex hull object representing an ellipsoid or other shape
Returns
- ndarray, shape (N_points,)
Boolean array indicating whether each point is inside the convex hull
See Also
Reassign shared voxels among ellipsoids to the most appropriate ellipsoid based on node overlap and proximity to ellipsoid centers
This function identifies voxels that are contained within multiple ellipsoids and resolves conflicts by: 1. Removing the shared voxel from all ellipsoids initially. 2. Assigning the voxel to the ellipsoid with the largest number of shared nodes. 3. If multiple ellipsoids have the same node overlap, assigning the voxel to the closest
ellipsoid based on center distance.
If still tied, assigning to the ellipsoid with the smallest volume.
Parameters
- cooDictdict
Dictionary mapping voxel IDs to their coordinates in 3D space. Example: {voxel_id: [x, y, z], …}
- Ellipsoidslist
List of ellipsoid objects from the packing routine. Each ellipsoid must have attributes: - inside_voxels (list of voxel IDs contained in the ellipsoid) - id (unique identifier) - get_pos() method returning the ellipsoid center coordinates as [x, y, z] - get_volume() method returning the ellipsoid volume
- voxel_dictdict
Dictionary mapping voxel IDs to the node IDs that define the voxel. Example: {voxel_id: [node1, node2, …], …}
Notes
The reassignment loop has a maximum of 5 cycles to avoid infinite loops in edge cases.
A voxel is assigned to an ellipsoid only if it has at least 4 nodes in common with it.
Distance calculations assume Cartesian coordinates.
The function can handle ties in node overlap by considering proximity and volume.
Modifies inside_voxels lists of ellipsoids in place.
- kanapy.core.voxelization.voxelizationRoutine(Ellipsoids, mesh, nphases, prec_vf=None)[source]
Perform voxelization of a microstructure defined by ellipsoids and mesh.
This function controls the voxelization process by calling several subroutines: -
kanapy.input_output.read_dump()-create_voxels()-assign_voxels_to_ellipsoid()-reassign_shared_voxels()Depending on whether ellipsoids have inner polygons, it either assigns voxels directly to ellipsoids or uses polygon-based voxel assignment.
The function also generates: - mesh.grains: array of voxelized structure with grain IDs - mesh.phases: array of voxelized structure with phase numbers - mesh.grain_dict: dictionary mapping grain IDs to voxel IDs - mesh.grain_phase_dict: dictionary mapping grain IDs to phase numbers - mesh.ngrains_phase: count of grains per phase - mesh.prec_vf_voxels: current volume fraction if prec_vf is provided
Parameters
- Ellipsoidslist
List of ellipsoid objects representing grains. Each ellipsoid should have: - inside_voxels (list of voxel IDs) - duplicate (ID of original ellipsoid if duplicated, else None) - inner (optional polygon object) - phasenum (phase number) - get_pos() and create_poly() methods.
- meshobject
Mesh object containing voxel information, including: - vox_center_dict (voxel centers) - voxel_dict (voxel-to-node mapping) - nvox (number of voxels) - dim (mesh dimensions)
- nphasesint
Number of phases in the RVE.
- prec_vffloat, optional
Target volume fraction for precipitates/porosity. Defaults to None (fully filled RVE).
Notes
Voxels shared by multiple ellipsoids are resolved using reassign_shared_voxels.
Voxels not assigned to any grain are either assigned to neighbors or set to phase 1.
If prec_vf < 1.0, empty voxels are treated as dispersed phase (precipitates/porosity).
The function modifies the mesh object in place.
Returns
- mesh
The input mesh object with updated voxelized grain and phase information.
Module grains
Subroutines for analysis of grains in microstructure
@author: Alexander Hartmaier ICAMS, Ruhr University Bochum, Germany March 2024
- kanapy.core.grains.calc_polygons(rve, mesh, tol=0.001)[source]
Evaluates grain volumes and the shared surface area of grain boundaries between neighboring grains in a voxelized microstructure. Generates vertices at contact points where three or more grains meet and constructs polyhedral convex hulls for these vertices.
Parameters
- rvekanapy object
Object containing information about the RVE geometry.
- meshkanapy object
Object containing voxel mesh details and grain assignments for each voxel.
- tolfloat, optional
Tolerance for numerical operations. Default is 1.e-3.
Returns
- geometrydict
Dictionary containing the calculated geometrical information, including vertices, contact points, and convex hulls for grains.
Notes
For periodic structures, large grains spanning both halves of the simulation box and touching a boundary may be incorrectly split, which can affect geometry calculations.
Module rve_stats
- Subroutines for analysis of statistical descriptors of RVEs:
original particles (or their inner polyhedra)
voxel structure
polyhedral grain structure
@author: Alexander Hartmaier ICAMS, Ruhr University Bochum, Germany March 2024
- class kanapy.core.rve_stats.VoxelMesh(nodes: ndarray, voxel_dict: Dict[int, List[int]], grain_dict: Dict[int, List[int]], grain_phase_dict: Dict[int, int])[source]
Bases:
objectMinimal mesh object compatible with knpy.core.rve_stats.get_stats_vox(mesh,…).
- Expected public attributes:
nodes : (Nnodes, 3) float array
voxel_dict : {voxel_id: [n1..n8]} (1-based node ids)
grain_dict : {grain_id: [voxel_id, …]}
grain_phase_dict : {grain_id: phase_id}
- classmethod from_dataObject(json_path: str | Path, *, snapshot_index: int = -1, origin_mode: str = 'centroid_min', convert_to_um: bool = True) VoxelMesh[source]
- grain_dict: Dict[int, List[int]]
- grain_phase_dict: Dict[int, int]
- nodes: ndarray
- voxel_dict: Dict[int, List[int]]
- kanapy.core.rve_stats.append_regridded_snapshot(json_path: str | Path, idx: ndarray, grid_size_new: List[float], grid_spacing_new: List[float], voxel_counts_new: List[int], *, snapshot_index: int = -1, out_path: str | Path | None = None, verbose: bool = True) Path[source]
Append a regridded copy of a target snapshot to the microstructure time series.
The target snapshot (selected by snapshot_index) is preserved unchanged. A new snapshot is appended at the end of
data["microstructure"]with:updated grid metadata (regular grid),
regridded voxel geometry (index, centroid, id, volume),
voxel fields copied from the source snapshot via the mapping idx.
Mapping convention
- idx is a 3D integer array of shape (Nx, Ny, Nz) with 0-based indexing:
src_linear = idx[i, j, k]
where (i, j, k) correspond to the new-grid cell indices (0-based). The JSON voxel list is written in k-fastest order (as you observed):
voxel 1: [1,1,1], voxel 2: [1,1,2], …
Fields copied vs updated
- Copied from the source voxel (selected by idx[i,j,k]):
grain_id
orientation
deformation_gradient
first_piola_kirchhoff_stress
strain
- Updated (recomputed) in the new voxel:
voxel_id (contiguous 1..Nnew)
voxel_index ([i+1, j+1, k+1], 1-based)
centroid_coordinates (regular grid cell centers)
voxel_volume (uniform; product of grid_spacing_new)
Parameters
- json_pathstr or pathlib.Path
Path to the input JSON file.
- idxnumpy.ndarray, shape (Nx, Ny, Nz)
Mapping from new-grid cells to indices of the source snapshot voxel list. Must be integer indices in [0, n_old-1].
- grid_size_newlist of float, length 3
New physical grid size.
- grid_spacing_newlist of float, length 3
New uniform grid spacing.
- voxel_counts_newlist of int, length 3
New voxel counts (Nx, Ny, Nz). Must match idx.shape.
- snapshot_indexint, optional
Snapshot to regrid. Default is -1 (last snapshot).
- out_pathstr or pathlib.Path or None, optional
If provided, write to this path; otherwise overwrite json_path.
- verbosebool, optional
Print a short summary. Default is True.
Returns
- pathlib.Path
Path to the written JSON file.
Raises
- ValueError
If idx.shape does not match voxel_counts_new, or if idx contains indices outside the source voxel list range.
- KeyError
If required copied fields are missing from the source voxel dict.
- kanapy.core.rve_stats.arr2mat(mc)[source]
Convert a 6-element numpy array into a 3x3 symmetric matrix
Parameters
- mcarray-like of length 6
Input array containing the elements of a symmetric matrix in Voigt notation: [M11, M22, M33, M23, M13, M12]
Returns
- matndarray of shape (3, 3)
Symmetric 3x3 matrix corresponding to the input array
- kanapy.core.rve_stats.bbox(pts, return_vector=False, two_dim=False)[source]
Approximate the smallest rectangular cuboid around points of a grain
The function computes the principal axes and lengths of a cuboid that encloses the grain, allowing analysis of prolate (aspect ratio > 1) and oblate (aspect ratio < 1) particles. For 2D points, only two axes are returned.
Parameters
- pts(N, dim) ndarray
Coordinates of points representing the grain
- return_vectorbool, default=False
If True, return the unit vectors along each principal axis
- two_dimbool, default=False
If True, treat points as 2D; otherwise, treat as 3D
Returns
- If two_dim is True:
- len_afloat
Semi-major axis length
- len_bfloat
Semi-minor axis length
- ax_a(dim,) ndarray, optional
Unit vector along major axis (only if return_vector=True)
- ax_b(dim,) ndarray, optional
Unit vector along minor axis (only if return_vector=True)
- If two_dim is False:
- len_afloat
Semi-major axis length
- len_bfloat
Semi-intermediate axis length
- len_cfloat
Semi-minor axis length
- ax_a(3,) ndarray, optional
Unit vector along major axis (only if return_vector=True)
- ax_b(3,) ndarray, optional
Unit vector along intermediate axis (only if return_vector=True)
- ax_c(3,) ndarray, optional
Unit vector along minor axis (only if return_vector=True)
- kanapy.core.rve_stats.build_and_save_stats_data(initial_state: Dict[str, Any] | None, regridded_state: Dict[str, Any], json_updated: str | Path, *, filename: str = 'stats_data.json') Dict[str, Any][source]
Build the STATS_DATA dictionary (exact structure as provided) and save it as JSON next to the data_object.json file.
Parameters
- initial_state
Statistics dict returned by knpy.core.rve_stats.get_stats_vox for the initial mesh. Can be None.
- regridded_state
Statistics dict returned by knpy.core.rve_stats.get_stats_vox for the regridded mesh.
- json_updated
Path to the data_object.json file (used only to locate output directory).
- filename
Output JSON filename saved next to json_updated.
Returns
- dict
STATS_DATA with keys: “semi_axes”, “aspect”, “eq_diam”.
- kanapy.core.rve_stats.build_stats_data(initial_state: Dict[str, Any] | None, regridded_state: Dict[str, Any], json_updated: str | Path, *, filename: str = 'stats_data.json') Dict[str, Any][source]
Build the STATS_DATA dictionary (exact structure as provided) and save it as JSON next to the data_object.json file.
Parameters
- initial_state
Statistics dict returned by knpy.core.rve_stats.get_stats_vox for the initial mesh. Can be None.
- regridded_state
Statistics dict returned by knpy.core.rve_stats.get_stats_vox for the regridded mesh.
- json_updated
Path to the data_object.json file (used only to locate output directory).
- filename
Output JSON filename saved next to json_updated.
Returns
- dict
STATS_DATA with keys: “semi_axes”, “aspect”, “eq_diam”.
- kanapy.core.rve_stats.calc_stats_dict(a, b, c, eqd)[source]
Calculate statistical descriptors of grain semi-axes and equivalent diameters
Computes log-normal parameters, identifies the rotation axis, and calculates aspect ratios for a set of grain semi-axes and equivalent diameters.
Parameters
- andarray
Array of semi-axis a lengths
- bndarray
Array of semi-axis b lengths
- cndarray
Array of semi-axis c lengths
- eqdndarray
Array of equivalent diameters
Returns
- sddict
Dictionary containing sorted semi-axes, equivalent diameters, their log-normal parameters (sigma and scale), rotation axis index, aspect ratios, and related statistics
- kanapy.core.rve_stats.con_fun(mc)[source]
Constraint function: penalizes non-positive-definite matrices
For a symmetric matrix, all eigenvalues must be positive. This constraint returns a large negative value if the matrix has negative eigenvalues.
Parameters
- mcarray-like of length 6
Input array representing a symmetric 3x3 matrix in Voigt notation
Returns
- float
The smallest eigenvalue multiplied by 1000, serving as a penalty for negative eigenvalues
- kanapy.core.rve_stats.find_rot_axis(len_a, len_b, len_c)[source]
Determine the rotation axis of an ellipsoid based on its three semi-axes
The function identifies the axis of approximate rotational symmetry. If no clear symmetry is found, the longest axis is chosen as the rotation axis.
Parameters
- len_afloat
Length of the first semi-axis
- len_bfloat
Length of the second semi-axis
- len_cfloat
Length of the third semi-axis
Returns
- irotint
Index of the rotation axis (0 for a, 1 for b, 2 for c)
- kanapy.core.rve_stats.get_diameter(pts)[source]
Estimate the largest diameter of a set of points along Cartesian axes
Parameters
- ptsndarray, shape (N, dim)
Point set in dim dimensions
Returns
- diameterndarray, shape (dim,)
Vector connecting the two points with the largest separation along the axis of maximum extent
- kanapy.core.rve_stats.get_grain_geom(points, method='raw', two_dim=False)[source]
Fit an ellipse to the 2D convex hull of grain pixels
Depending on the chosen method, the ellipse can be obtained from direct fitting, PCA, or a rectangular bounding box. Currently, 3D grains are not supported.
Parameters
- points(N, 2) ndarray
Coordinates of points on the grain hull
- methodstr, default=’raw’
Method to obtain ellipse parameters: - ‘raw’: rectangular bounding box - ‘pca’: principal component analysis - ‘ell’, ‘ellipsis’, ‘e’: direct ellipse fitting
- two_dimbool, default=False
If True, process as 2D data; 3D is not yet implemented
Returns
- eafloat
Semi-major axis length (a >= b)
- ebfloat
Semi-minor axis length
- va(2,) ndarray
Unit vector along the major axis
- vb(2,) ndarray
Unit vector along the minor axis
- kanapy.core.rve_stats.get_ln_param(data)[source]
Compute log-normal parameters (sigma and scale) from a dataset
This function calculates the parameters for a log-normal distribution by taking the logarithm of positive data points and computing the standard deviation and median-based scale.
Parameters
- dataarray-like
Input data array. Values should be non-negative.
Returns
- sigfloat
Standard deviation of the log-transformed data
- scalefloat
Scale parameter of the log-normal distribution (exp of median)
- kanapy.core.rve_stats.get_stats_part(part, iphase=None, ax_max=None, minval=1e-05, show_plot=True, verbose=False, save_files=False)[source]
Extract statistics of particles and optionally their inner structures
Fits a 3D ellipsoid to each particle or its inner structure, calculates semi-axes, equivalent diameters, and statistical descriptors of the microstructure.
Parameters
- partlist
List of particle objects, each with attributes a, b, c or inner.points
- iphaseint, optional
Phase number to restrict analysis to, default is None (all phases)
- ax_maxfloat, optional
Maximum allowed semi-axis, used to adjust minval for numerical stability
- minvalfloat, optional
Minimum allowed eigenvalue for positive-definiteness, default 1.e-5
- show_plotbool, optional
Whether to display plots of the statistics, default True
- verbosebool, optional
If True, print detailed information during processing, default False
- save_filesbool, optional
If True, save plots as files, default False
Returns
- part_stats_dictdict
Dictionary containing semi-axes, equivalent diameters, log-normal parameters, rotation axis index, aspect ratios, and related statistics
- kanapy.core.rve_stats.get_stats_poly(grains, iphase=None, ax_max=None, phase_dict=None, minval=1e-05, show_plot=True, verbose=False, save_files=False)[source]
Extract statistics about the microstructure from polyhedral grains
Fits a 3D ellipsoid to each polyhedron to compute semi-axes, equivalent diameters, and other statistical descriptors.
Parameters
- grainsdict
Dictionary of polyhedral grains with ‘Points’ for each grain
- iphaseint, optional
Phase number to restrict analysis to, default is None (all phases)
- phase_dictdict, optional
Dictionary mapping grain ID to phase number, required if iphase is provided
- ax_maxfloat, optional
Maximum allowed semi-axis, used to adjust minval for numerical stability
- minvalfloat, optional
Minimum allowed eigenvalue for positive-definiteness, default 1.e-5
- show_plotbool, optional
Whether to display plots of the statistics, default True
- verbosebool, optional
If True, print detailed information during processing, default False
- save_filesbool, optional
If True, save plots as files, default False
Returns
- poly_stats_dictdict
Dictionary containing semi-axes, equivalent diameters, log-normal parameters, rotation axis index, aspect ratios, and related statistics
- kanapy.core.rve_stats.get_stats_vox(mesh, iphase=None, ax_max=None, minval=1e-05, show_plot=True, verbose=False, save_files=False)[source]
Extract statistics of the microstructure from voxels
Analyses nodes at grain boundaries, constructs a rectangular bounding box, and calculates semi-axes, equivalent diameters, and statistical descriptors.
Parameters
- meshobject
Mesh object containing grain and voxel information
- iphaseint, optional
Phase number to restrict analysis to, default is None (all phases)
- ax_maxfloat, optional
Maximum allowed semi-axis, used to adjust minval for numerical stability
- minvalfloat, optional
Minimum allowed eigenvalue for positive-definiteness, default 1.e-5
- show_plotbool, optional
Whether to display plots of the statistics, default True
- verbosebool, optional
If True, print detailed information during processing, default False
- save_filesbool, optional
If True, save plots as files, default False
Returns
- vox_stats_dictdict
Dictionary containing semi-axes, equivalent diameters, log-normal parameters, rotation axis index, aspect ratios, and related statistics
- kanapy.core.rve_stats.project_pts(pts, ctr, axis)[source]
Project points to a plane defined by a center point and a normal vector
Parameters
- ptsndarray, shape (N, dim)
Point set in dim dimensions
- ctrndarray, shape (dim,)
Center point of the projection plane
- axisndarray, shape (dim,)
Unit vector normal to the plane
Returns
- pptndarray, shape (N, dim)
Points projected onto the plane
- kanapy.core.rve_stats.pts_in_ellips(Mcomp, pts)[source]
Check how well a set of points satisfy the equation of an ellipsoid (pts - ctr)^T M (pts - ctr) = 1
Parameters
- Mcomparray-like, shape (6,)
Components of a symmetric matrix representing the ellipsoid.
- ptsarray-like, shape (N, 3)
Coordinates of points to be tested.
Returns
- scorefloat
Average deviation of points from the ellipsoid equation. Lower values indicate points are closer to lying on the ellipsoid surface.
- kanapy.core.rve_stats.regrid(json_path: str | Path, F_average: ndarray, new_grid_cell: List[int], *, snapshot_index: int = -1, spacing_sigfig: int = 1, verbose: bool = True) Tuple[ndarray, ndarray][source]
Build a voxel-index remapping from a deformed periodic box to a new regular grid.
The reference box (old grid size/spacing) is taken from snapshot 0 in the JSON. A periodic “search box” is constructed from the provided average deformation gradient, then each new-grid cell center is mapped to the nearest voxel centroid of the target snapshot under periodic boundary conditions.
Parameters
- json_pathstr or pathlib.Path
Path to the JSON file containing the microstructure time series.
- F_averagenumpy.ndarray, shape (3, 3)
Average deformation gradient (unitless).
- new_grid_celllist of int, length 3
Number of cells (Nx, Ny, Nz) of the new grid to remesh onto.
- snapshot_indexint, optional
Target snapshot index to use for voxel centroids. Default is -1 (last).
- spacing_sigfigint, optional
Reserved for consistency with other workflow steps. Not used in this function at the moment. Default is 1.
- verbosebool, optional
If True, prints progress and key computed values. Default is True.
Returns
- idxnumpy.ndarray, shape (Nx, Ny, Nz)
For each new-grid cell, the index into the original voxel list (0..Nvox-1) of the nearest voxel centroid under periodic boundary conditions.
- boxnumpy.ndarray, shape (3,)
Periodic box lengths (Lx, Ly, Lz) used for the remeshing search.
Notes
The mapping is computed using a periodic cKDTree query on centroid positions.
To reduce boundary artifacts, the voxel centroid cloud can be repeated periodically using repeats. In your current workflow, repeats may be [1,1,1], which is valid when boxsize=box is used.
This function assumes voxel centroid coordinates are in the same length unit as the grid stored in the JSON (typically meters), and that F_average is unitless.
- kanapy.core.rve_stats.update_grid(json_path: str | Path, snapshot_index: int = -1, spacing_sigfig: int = 1) Tuple[List[float], List[float], List[int], ndarray][source]
Update grid size, spacing, and voxel counts based on the average deformation gradient of a selected snapshot in a microstructure time series.
The function assumes that all length-related quantities are expressed in the unit specified by
units["Length"]in the JSON file. If the unit is"m", values are used directly without conversion. Other units are currently not supported and will raise an error.The average deformation gradient is computed from voxel-level data and returned as a numeric NumPy array. Any rounding applied to the deformation gradient is for printing only and does not modify the returned values unless explicitly rounded in code.
Parameters
- json_pathstr or pathlib.Path
Path to the JSON file containing the microstructure time series.
- snapshot_indexint, optional
Index of the target snapshot used to compute the deformation. Defaults to -1 (last snapshot).
- spacing_sigfigint, optional
Number of significant figures used when rounding the uniform grid spacing. Default is 1.
Returns
- grid_size_newlist of float
Updated physical grid size (same length unit as the input JSON).
- grid_spacing_newlist of float
Updated uniform grid spacing (same length unit as the input JSON).
- voxel_counts_newlist of int
Updated number of voxels along each spatial direction.
- F_avgnumpy.ndarray, shape (3, 3)
Average deformation gradient of the selected snapshot. This array is returned as numeric data with full floating-point precision; any reduced precision shown in printed output is for display only.
Raises
- ValueError
If
units["Length"]is not"m".
Module texture
Tools for analysis of EBSD maps in form of .ang files
@author: Alexander Hartmaier, Abhishek Biswas, ICAMS, Ruhr-Universität Bochum
- class kanapy.texture.DeLaValleePoussinKernel(kappa=None, halfwidth=None, bandwidth=None)[source]
Bases:
KernelDe La Vallee Poussin kernel class for orientation distribution functions
Parameters
- kappafloat, optional
Shape parameter of the kernel
- halfwidthfloat, optional
Halfwidth in radians; overrides kappa if provided
- bandwidthint, optional
Maximum degree of the series expansion
Attributes
- Andarray
Series coefficients of the kernel
- kappafloat
Shape parameter of the kernel
- Cfloat
Normalization constant
- DK(co2)[source]
Evaluate the derivative of the De La Vallee Poussin kernel with respect to misorientation.
Parameters
- co2float or ndarray
Cosine of half the misorientation angle. Values should be in [-1, 1].
Returns
- float or ndarray
Derivative of the kernel function evaluated at the input co2.
- DRK(t)[source]
Evaluate the derivative of the reduced kernel function R_K at a given input.
Parameters
- tfloat or ndarray
Input value, typically representing a normalized distance or cosine value.
Returns
- float or ndarray
Value of the derivative of R_K at t.
- K(co2)[source]
Evaluate the De La Vallee Poussin kernel function.
Parameters
- co2float or ndarray
Cosine of half the misorientation angle. Values will be clipped to [-1, 1].
Returns
- float or ndarray
Kernel value(s) evaluated at the input co2.
- class kanapy.texture.EBSDmap(fname, gs_min=10.0, vf_min=0.03, max_angle=5.0, connectivity=8, show_plot=True, show_hist=None, felzenszwalb=False, show_grains=False, hist=None, plot=None)[source]
Bases:
objectClass to store attributes and methods to import EBSD maps and filter out their statistical data needed to generate synthetic RVEs
Parameters
- fnamestr
Filename including path to EBSD file.
- gs_minfloat, optional
Minimum grain size in pixels. Grains smaller than this are disregarded for statistical analysis. Default is 10.0.
- vf_minfloat, optional
Minimum volume fraction. Phases with smaller values are disregarded. Default is 0.03.
- max_anglefloat, optional
Maximum misorientation angle (degrees) used for grain merging. Default is 5.0.
- connectivityint, optional
Connectivity for grain identification. Default is 8.
- show_plotbool, optional
If True, plots microstructure maps. Default is True.
- show_histbool, optional
If True, plots histograms of grain statistics. Default follows show_plot.
- felzenszwalbbool, optional
If True, applies Felzenszwalb segmentation. Default is False.
- show_grainsbool, optional
If True, plots grain labeling. Default is False.
- histbool, optional
Deprecated. Use show_hist instead.
- plotbool, optional
Deprecated. Use show_plot instead.
Attributes
- emapobject
Loaded EBSD map object.
- sh_x, sh_yint
Shape of EBSD map in pixels.
- dx, dyfloat
Pixel size in microns.
- npxint
Total number of pixels in the map.
- ms_datalist of dict
Phase-specific microstructure information including: - name : str — phase name - vf : float — volume fraction - index : int — phase index - ori : Orientation — grain orientations - cs : crystal symmetry / Laue group - mo_map : ndarray — misorientation field - rgb_im : ndarray — IPF color image - ngrains : int — number of grains - gs_param, ar_param, om_param : ndarray — grain size, aspect ratio, main axis angle parameters - gs_data, ar_data, om_data : ndarray — raw distributions - gs_moments, ar_moments, om_moments : list — distribution moments - graph : object — microstructure graph
- ci_mapndarray
Optional confidence index map if available.
- ngrainsint
Total number of grains after merging/pruning.
- calcORI(Ng, iphase=0, shared_area=None, nbins=12, res_low=5, res_high=25, res_step=2, lim=5, hw_init=None, verbose=False, full_output=False)[source]
Estimate optimum kernel half-width and produce reduced set of orientations for given number of grains
Parameters
- Ngint
Numbr of grains for which orientation is requested.
- iphaseint, optional
Phase for which data is requested. The default is 0.
- shared_areaarray, optional
Grain boundary data. The default is None.
- nbinsint, optional
number of bins for GB texture. The default is 12.
Returns
- ori(Ng, 3)-array
Array with Ng Euler angles.
- plot_felsenszwalb()[source]
Apply Felzenszwalb segmentation to the misorientation map and plot the results
Notes
Segments the misorientation map using the Felzenszwalb algorithm and overlays the segment boundaries for visualization.
- plot_grains(N=5)[source]
Plot the N largest grains with one-hot maps, convex hulls, and principal axes
Parameters
- Nint, optional
Number of largest grains to plot for each phase. Default is 5.
Notes
Each grain is visualized with its pixels, convex hull, and major/minor axes. Major axes are plotted in cyan, minor axes in green.
- plot_grains_marked()[source]
Plot grains with labels and major/minor axes for all phases
Notes
Each grain is annotated with its number. Major axes are plotted in black, minor axes in red. The plot uses a distinct colormap for different grains.
- plot_graph()[source]
Visualize the microstructure graph for all phases
Notes
Uses the visualize_graph function to display nodes and connections of each phase’s graph.
- plot_ipf_map()[source]
Plot the IPF (inverse pole figure) map for all phases
Notes
Pixels belonging to other phases are set to black. Each phase is visualized separately.
- plot_mo_map()[source]
Plot the misorientation map for all phases
Notes
Shows the misorientation angle of each pixel with respect to a reference orientation.
- plot_pf(vector=None)[source]
Plot pole figures for all phases using the specified sample direction
Parameters
- vectorarray-like, optional
Sample reference vector for the pole figure. Default is [0, 0, 1].
Notes
Plots <111> poles in the sample reference frame for each phase.
- plot_pf_proj(vector=None)[source]
Plot projected pole figures for all phases using the specified sample direction
Parameters
- vectorarray-like, optional
Sample reference vector for the projected pole figure. Default is [0, 0, 1].
Notes
Uses a projection method to visualize <111> poles in the sample reference frame.
- plot_segmentation(show_mo=True, show_ipf=True)[source]
Plot segmentation results for all phases
Parameters
- show_mobool, optional
If True, overlay grain boundaries on the misorientation map. Default is True.
- show_ipfbool, optional
If True, overlay grain boundaries on the IPF map. Default is True.
Notes
Uses similarity-based segmentation to highlight grain boundaries on the maps.
- class kanapy.texture.Kernel(A=None)[source]
Bases:
ABCAbstract base class for kernels used in orientation distribution estimation.
Attributes
- Andarray
Flattened array of kernel parameters. Initialized to empty array if not provided.
- K(co2)[source]
Evaluate the kernel function at a given squared cosine value.
Parameters
- co2float or ndarray
Cosine squared value(s), will be clipped to [-1, 1].
Returns
- float or ndarray
Value(s) of the kernel function.
- K_orientations(orientations_ref, orientations)[source]
Evaluate the kernel function for the misorientation angles between two sets of orientations.
Parameters
- orientations_refOrientation
Reference set of orientations.
- orientationsOrientation
Target set of orientations to compare.
Returns
- ndarray
Kernel values corresponding to misorientation angles.
- RK(d)[source]
Evaluate the kernel using the Clenshaw-L method for given cosine distances.
Parameters
- darray_like
Cosine of angles (distance metric) in the range [-1, 1].
Returns
- ndarray
Kernel values for the given distances.
- RRK(dh, dr)[source]
Evaluate the kernel on two sets of cosine distances using a reduced rotational kernel.
Parameters
- dharray_like
Cosines of angles for the first set, clipped to [-1, 1].
- drarray_like
Cosines of angles for the second set, clipped to [-1, 1].
Returns
- ndarray
2D array of kernel values for each combination of dh and dr.
- property bandwidth
Returns the bandwidth of the kernel.
The bandwidth is defined as the number of elements in A minus one.
Returns
- int
Bandwidth of the kernel.
- calc_fourier(L, max_angle=3.141592653589793, fft_accuracy=0.01)[source]
Compute the Fourier coefficients of the kernel up to order L.
Parameters
- Lint
Maximum order of the Fourier coefficients.
- max_anglefloat, optional
Upper limit of integration in radians (default is pi).
- fft_accuracyfloat, optional
Threshold below which coefficients are considered negligible and computation stops early (default is 1e-2).
Returns
- ndarray
Array of Fourier coefficients of length <= L+1.
- cutA(fft_accuracy=0.01)[source]
Truncate the kernel array A based on the specified FFT accuracy.
Elements of A are scaled by 1/(l^2), and elements smaller than a threshold determined from fft_accuracy are removed.
Parameters
- fft_accuracyfloat, optional
Desired FFT accuracy (default is 1e-2).
Notes
The first element is never truncated.
- halfwidth()[source]
Compute the halfwidth of the kernel.
The halfwidth is determined by finding the angle omega that minimizes the squared difference between K(1) and 2*K(cos(omega/2)).
Returns
- float
Halfwidth angle in radians.
- class kanapy.texture.ODF(orientations, halfwidth=np.float64(0.17453292519943295), weights=None, kernel=None, exact=False)[source]
Bases:
objectEstimate an Orientation Distribution Function (ODF) from a set of orientations using kernel density estimation.
Parameters
- orientationsorix.quaternion.Orientation
Input orientation set.
- halfwidthfloat, optional
Halfwidth of the kernel in radians (default: 10 degrees).
- weightsarray-like, optional
Weights for each orientation. If None, uniform weights are used.
- kernelKernel instance, optional
Kernel function to use. If None, DeLaValleePoussinKernel is used.
- exactbool, optional
If False and orientation count > 1000, approximation using grid is applied.
Attributes
- orientationsorix.quaternion.Orientation
Orientation set stored in the ODF.
- weightsndarray
Normalized weights of the orientations.
- kernelKernel
Kernel used for density estimation.
- halfwidthfloat
Halfwidth of the kernel in radians.
- kanapy.texture.add_ipf_color(json_path: str | Path, l: Sequence[float] = (1, 0, 0), *, out_path: str | Path | None = None) Path[source]
Add per-voxel IPF RGB colors to every snapshot in the JSON.
Reads symmetry from: data[“phases”][0][“orientation”][“crystal_symmetry_group”]
Computes IPF color along lab direction l (default (1,0,0))
- Writes into each voxel:
“IPFcolor_(l0 l1 l2)”: [R, G, B] (8-bit)
Assumptions: - Single phase (data[“phases”] has exactly one element). - Voxel orientation stored as Euler angles [phi1, Phi, phi2] in radians.
- kanapy.texture.build_graph_from_labeled_pixels(label_array, rot, sym, dx, dy, connectivity=8)[source]
Build a graph representation of a microstructure from labeled pixels
Each node in the graph represents a grain (label) and stores pixel indices, average orientation, and orientation statistics. Edges connect neighboring grains based on pixel adjacency.
Parameters
- label_arrayndarray of shape (H, W)
2D array of integer labels representing grains.
- emapobject
Orientation map object containing: - rotations.data : orientation vectors for each pixel - phases.point_groups : symmetry information for each phase - dx, dy : pixel spacing in x and y directions
- phaseint
Phase index to select the corresponding symmetry from emap.phases.point_groups.
- connectivityint, optional
Connectivity criterion for neighbors (4 or 8). Default is 8.
Returns
- networkx.Graph
Graph object with: - Nodes representing grains, storing ‘pixels’, ‘ori_av’, ‘ori_std’, ‘npix’ - Edges representing neighboring grains (shared boundaries) - Graph attributes: ‘label_map’, ‘symmetry’, ‘dx’, ‘dy’
Notes
Uses summarize_labels to extract node properties from labeled pixels
Loops over all pixels to add edges between neighboring grains
The function preserves the shape and indices of label_array
- kanapy.texture.calc_error(odf_ref, odf_test, res=10.0)[source]
Compute the normalized difference between two orientation distribution functions (ODFs)
This function evaluates the ODFs on a sample grid in fundamental space and computes the L1 norm of the difference after normalization.
Parameters
- odf_refobject
Reference ODF object. Must have .orientations.symmetry and .evaluate() method.
- odf_testobject
Test ODF object to compare. Must have the same symmetry as odf_ref.
- resfloat, optional
Resolution for sampling the fundamental space grid. Default is 10.
Returns
- float
L1 error between the normalized ODFs.
Notes
Raises a RuntimeError if the symmetries of the two ODFs do not match.
Uses get_sample_fundamental to sample the fundamental zone and Orientation for evaluation.
Does not modify the input ODFs.
- kanapy.texture.calc_orientations(odf, nori, res=None)[source]
Generate a set of orientations sampled from an orientation distribution function (ODF)
This function uses Monte Carlo sampling to generate nori orientations according to the probabilities defined by the input ODF. Sampling is performed in the fundamental zone of the crystal symmetry.
Parameters
- odfobject
Orientation distribution function object. Must have .orientations.symmetry and .evaluate() method.
- noriint
Number of orientations to generate.
- resfloat, optional
Angular resolution in degrees for sampling the fundamental zone grid. If None, a resolution between 2° and 5° is selected based on ODF half-width.
Returns
- Orientation
Orientation object containing nori orientations sampled from the ODF.
Notes
Raises a RuntimeError if the Monte Carlo sampling does not converge after 200 iterations.
Logs a warning if the SO3 grid resolution is too coarse for the requested number of orientations.
Uses get_sample_fundamental to generate the sampling grid and Orientation to store results.
Does not modify the input ODF.
- kanapy.texture.createOriset(num, ang, omega, hist=None, shared_area=None, cs=None, degree=True, Nbase=10000, resolution=None, res_low=5, res_high=25, res_step=2, lim=5, hw_init=None, verbose=False, full_output=False)[source]
Create a set of Euler angles according to an ODF defined by input orientations and kernel half-width
Parameters
- numint
Number of Euler angles to generate
- ang(3,) or (M, 3) array or Orientation
Input set of Euler angles (in degrees or radians) defining the ODF
- omegafloat
Kernel half-width (in degrees or radians)
- histarray, optional
Histogram of MDF. Default is None
- shared_areaarray, optional
Shared area between pairs of grains. Default is None
- csSymmetry, optional
Crystal symmetry group. Default is ‘m3m’
- degreebool, optional
If True, input angles and omega are in degrees. Default is True
- Nbaseint, optional
Base number of orientations for artificial ODF. Default is 10000
- resolutionfloat, optional
Resolution for orientation generation. If None, derived from omega
- res_low, res_high, res_step, limint, optional
Parameters for texture reconstruction
- verbosebool, optional
If True, prints progress messages. Default is False
- full_outputbool, optional
If True, returns additional reconstruction outputs. Default is False
Returns
- ori(num, 3) ndarray
Reduced set of Euler angles
Notes
Can generate artificial ODFs if input set is small. Grain-boundary-texture reconstruction with hist or shared_area requires the kanapy-mtex module.
- kanapy.texture.createOrisetRandom(num, omega=None, hist=None, shared_area=None, cs=None, Nbase=None)[source]
Create a set of Euler angles for a random texture
Parameters
- numint
Number of Euler angles to generate
- omegafloat, optional
Kernel half-width in degrees. Default is 7.5
- histarray, optional
Histogram of MDF. Default is None
- shared_areaarray, optional
Shared area between pairs of grains. Default is None
- csSymmetry, optional
Crystal symmetry group. Default is ‘m3m’
- Nbaseint, optional
Base number of orientations for random texture. Default is 5000
Returns
- ori(num, 3) ndarray
Set of randomly distributed Euler angles
Notes
Unlike createOriset, this function directly generates num random orientations without reducing a larger artificial EBSD set. Grain-boundary-texture reconstruction using hist or shared_area requires the kanapy-mtex module.
- kanapy.texture.export_graph(G, filename, format='graphml')[source]
Export a microstructure graph to a file in the specified format
This function writes the NetworkX graph to disk in either GraphML or GEXF format.
Parameters
- Gnetworkx.Graph
Graph object representing the microstructure.
- filenamestr
Path to the output file.
- formatstr, optional
File format for export. Supported options are ‘graphml’ and ‘gexf’. Default is ‘graphml’.
Notes
Raises a ValueError if an unsupported format is provided
Does not modify the graph
- kanapy.texture.extract_initial_texture_dict(json_path: str | Path, *, ebsd: object = None, snap_idx_initial: int = 0, pole_vector: Tuple[int, int, int] = (0, 0, 1), initial_orientation_source: str = 'ebsd') Dict[str, Any][source]
Build the texture payload for the initial microstructure snapshot.
Returns
- dict
{‘O’: O0, ‘t_all’: t0_all, ‘n’: n0, ‘phase’: phase, ‘pole_vector’: tuple}
- kanapy.texture.extract_regridded_texture_dict(json_path: str | Path, *, ebsd: Any, pole_vector: Tuple[int, int, int] = (0, 0, 1), snap_idx_regridded: int | None = -1, target_time: float | None = None) Dict[str, Any][source]
Build the texture payload for a regridded (undeformed grid) snapshot.
Returns
- dict
{‘O’: OR, ‘t_all’: tR_all, ‘n’: nR, ‘phase’: phase, ‘pole_vector’: tuple}
- kanapy.texture.find_largest_neighbor(G, node)[source]
Find the largest neighboring node of a given node in a graph
This function iterates over all neighbors of the specified node and returns the neighbor with the largest ‘npix’ (number of pixels).
Parameters
- Gnetworkx.Graph
Graph object where nodes have an attribute ‘npix’ representing their size.
- nodeint
Node ID for which the largest neighbor is to be found.
Returns
- int
Node ID of the largest neighbor.
Notes
Raises a ValueError if the node has no neighbors.
Raises a ValueError if the graph contains circular edges (neighbor is the node itself).
Does not modify the graph.
- kanapy.texture.find_orientations_fast(ori1: Orientation, ori2: Orientation, tol: float = 0.001) ndarray[source]
Find closest matches in ori1 for each orientation in ori2 using KDTree
Parameters
- ori1Orientation
Orientation database (e.g., EBSD orientations).
- ori2Orientation
Orientations to match (e.g., grain mean orientations).
- tolfloat
Angular tolerance in radians.
Returns
- matchesnp.ndarray
Array of indices in ori1 matching each entry in ori2; -1 if no match found.
- kanapy.texture.find_sim_neighbor(G, nn)[source]
Find the neighboring node most similar in orientation to the given node
This function computes the misorientation angles between the given node and all its neighbors, and returns the neighbor with the smallest misorientation.
Parameters
- Gnetworkx.Graph
Graph object where nodes have an ‘ori_av’ attribute representing average orientation. The graph also contains a ‘symmetry’ key in G.graph used for orientation calculations.
- nnint
Node ID for which the most similar neighbor is to be found.
Returns
- tuple
A tuple (neighbor_id, angle) where: - neighbor_id : int, ID of the neighbor with smallest misorientation - angle : float, misorientation angle with the given node
Notes
Uses the Orientation class for misorientation calculations
Assumes all neighbors have a valid ‘ori_av’ attribute
Does not modify the graph
- kanapy.texture.find_similar_regions(array, tolerance=0.087, connectivity=1)[source]
Identify connected regions of similar values in a 2D array
This function labels all connected pixels in the input array whose values differ by at most tolerance. Connectivity can be 4- or 8-connected.
Parameters
- arrayndarray of shape (H, W)
2D input array with values to segment.
- tolerancefloat, optional
Maximum allowed difference between connected values. Default is 0.087.
- connectivityint, optional
Connectivity criterion for neighbors: 1 for 4-connectivity, 2 for 8-connectivity. Default is 1.
Returns
- labeled_arrayndarray of shape (H, W)
Array where each connected region of similar values has a unique label.
- num_featuresint
Total number of connected regions found.
Notes
Uses a depth-first search to find connected regions.
Does not modify the input array.
Assumes neighbors(i, j, connectivity) returns valid neighboring indices.
- kanapy.texture.get_distinct_colormap(N, cmap='prism')[source]
Generate N visually distinct colors as an RGB colormap.
Parameters: - N: int, number of colors - seed: optional int, random seed for reproducibility
Returns: - cmap: list of N RGB tuples in [0, 1]
- kanapy.texture.get_ipf_colors(ori_list, color_key=0)[source]
Get RGB colors for a list of orientations in radians
Parameters
- ori_list(N, 3) ndarray
List of N Euler angles in radians
- color_keyint, optional
Index of the IPF color key to use. Default is 0
Returns
- colors(N, 3) ndarray
RGB values corresponding to each orientation
Notes
Assumes cubic crystal symmetry and cubic specimen symmetry
- kanapy.texture.merge_nodes(G, node1, node2)[source]
Merge the pixel and attribute data of node1 into node2 in a graph
This function performs the following steps: 1. Concatenates the pixel lists of node1 and node2 and updates node2’s ‘pixels’ attribute 2. Updates the average orientation ‘ori_av’ and pixel count ‘npix’ for node2 3. Updates the convex hull for node2 if it exists 4. Adds edges from node1’s neighbors to node2, avoiding duplicates 5. Removes node1 from the graph 6. Updates the graph’s ‘label_map’ to replace all occurrences of node1 with node2
Parameters
- Gnetworkx.Graph
Graph object where nodes represent grains and have attributes: - ‘pixels’ : array of pixel indices - ‘ori_av’ : average orientation - ‘npix’ : number of pixels - optional ‘hull’ : ConvexHull object The graph also contains: - ‘label_map’ : 2D array of node labels - ‘dx’, ‘dy’ : pixel spacing in x and y directions
- node1int
Node ID to be merged and removed
- node2int
Node ID to merge into and retain
Notes
Modifies the graph G in place
Updates ‘pixels’, ‘ori_av’, ‘npix’, ‘hull’ for node2
Updates ‘label_map’ to replace node1 with node2
Adds new edges from node1 to node2 while avoiding duplicates
- kanapy.texture.neighbors(r, c, connectivity=8)[source]
Return the neighboring coordinates of a cell in a 2D grid.
Parameters
- rint
Row index of the cell.
- cint
Column index of the cell.
- connectivityint, optional
Type of connectivity. Options are: - 1 or 4 : 4-connected neighbors (up, down, left, right) - 8 : 8-connected neighbors (includes diagonals) Default is 8.
Returns
- neighborslist of tuple
List of (row, column) tuples representing neighboring cells.
Examples
>>> neighbors(2, 3, connectivity=4)
[(3, 3), (1, 3), (2, 4), (2, 2)]
>>> neighbors(2, 3)
[(3, 2), (3, 3), (3, 4), (2, 2), (2, 4), (1, 2), (1, 3), (1, 4)]
- kanapy.texture.odf_est(ori, odf, nstep=50, step=0.5, halfwidth=None, verbose=False)[source]
Estimate an ODF from a set of orientations using iterative half-width adjustment
This function generates a new orientation distribution function (ODF) from input orientations by iteratively adjusting the half-width to minimize the error relative to a reference ODF.
Parameters
- oriOrientation
Input orientations used to estimate the ODF.
- odfODF
Reference orientation distribution function for error comparison.
- nstepint, optional
Maximum number of iterations for adjusting the half-width. Default is 50.
- stepfloat, optional
Increment step in degrees for half-width adjustment. Default is 0.5.
- halfwidthfloat, optional
Initial half-width in radians. If None, a value based on odf.halfwidth is used.
- verbosebool, optional
If True, prints iteration details. Default is False.
Returns
- ODF
Estimated orientation distribution function corresponding to input orientations.
Notes
Uses calc_error to compare the estimated ODF with the reference ODF.
Iteratively increases half-width until the error starts to increase.
The returned ODF corresponds to the last half-width before error increased.
Does not modify the input orientations or reference ODF.
- kanapy.texture.plot_pole_figure(orientations, phase, vector=None, size=None, alpha=None)[source]
Plot an inverse pole figure and pole density function for given orientations
This function visualizes the orientation distribution of a crystal phase by plotting the stereographic projection of specified poles and the corresponding pole density function (PDF).
Parameters
- orientationsOrientation
Orientation object containing crystal orientations to plot.
- phaseobject
Crystal phase object containing symmetry information and name.
- vectorarray-like of shape (3,), optional
Miller indices of the pole vector to plot. Default is [0, 0, 1].
- sizefloat, optional
Marker size for scatter plot. Automatically scaled if None.
- alphafloat, optional
Marker transparency for scatter plot. Automatically scaled if None.
Notes
Uses Matplotlib for plotting with stereographic projection.
The first subplot shows the inverse pole figure (scatter of poles).
The second subplot shows the pole density function.
Marker size and transparency are scaled inversely with the number of orientations.
Does not modify the input orientations or phase.
- kanapy.texture.plot_pole_figure_proj(orientations, phase, vector=None, title=None, alpha=None, size=None)[source]
Plot an inverse pole figure (IPF) projection and pole density function for EBSD data
This function visualizes crystal orientations along a specified sample direction using an IPF projection. The first subplot shows the scatter of rotated poles, and the second subplot shows the corresponding pole density function (PDF).
Parameters
- orientationsOrientation
Orientation object containing crystal orientations to plot.
- phaseobject
Crystal phase object with symmetry information and name.
- vectorarray-like of shape (3,), optional
Sample direction to project (Miller indices). Default is [0, 0, 1].
- titlestr, optional
Title for the plot. If None, automatically uses the principal axis of vector.
- alphafloat, optional
Marker transparency for scatter plot. Automatically scaled if None.
- sizefloat, optional
Marker size for scatter plot. Automatically scaled if None.
Notes
Uses Matplotlib with stereographic projection (IPF) for plotting.
Marker size and transparency are scaled inversely with the number of orientations.
The first subplot shows the inverse pole figure (scatter of rotated poles).
The second subplot shows the pole density function (PDF).
Does not modify the input orientations or phase.
- kanapy.texture.segment_microstructure(json_path: str, *, th_cut_deg: float = 5.0, th_merge_deg: float = 7.5, min_voxels: int = 4, print_topk_rag: int = 10, tiny_cutoff: int = 5, verbose: bool = True, log_path: str | None = None, progress: bool = False) None[source]
Segment all snapshots in a microstructure JSON in-place.
Snapshot 0 is assumed already segmented and is kept as reference for phase_id mapping.
- Snapshots 1..last are re-segmented from voxel orientations using:
Step 1: 6-neighbor voxel graph + ORIX misorientation on edges Step 2: threshold cut (<= th_cut_deg) + connected components Step 3: segment-RAG boundary stats + ORIX mean orientation per segment Step 4: merge/prune via union-find:
Rule A: merge adjacent segments if mean-orientation miso <= th_merge_deg Rule B: absorb tiny components (<= min_voxels) into best neighbor using root-mean miso
Step 5: diagnostics (post-merge boundary stats) Step 6/7: write voxel grain_id + rebuild grains[] with ORIX mean orientation
This function overwrites json_path (no new file).
Parameters
- json_pathstr
Path to the JSON file to update in-place.
- th_cut_degfloat
Edge cut threshold in degrees (keep edges <= th_cut_deg).
- th_merge_degfloat
Merge threshold in degrees for Rule A (mean-orientation miso).
- min_voxelsint
Tiny component cutoff (<= min_voxels) for Rule B.
- print_topk_ragint
Number of highest-contact boundaries printed for diagnostics.
- tiny_cutoffint
Diagnostics: count segments with <= tiny_cutoff voxels after Step 2.
- verbosebool
Print progress and diagnostics.
Returns
- None
Updates the JSON file in-place.
- kanapy.texture.step1_extract_gid_arrays(json_path: str, t: int, verbose: bool = True, log_fh=None) Tuple[ndarray, ndarray, List[Tuple[int, int, int]]][source]
Step 1: Build aligned grain-id arrays for snapshots t and t+1 using voxel_index.
Parameters
- json_pathstr
Path to the microstructure JSON.
- tint
Snapshot index (tracks from t -> t+1).
- verbosebool
If True, prints alignment summary.
Returns
- gid_tnp.ndarray, shape (N,)
Grain IDs for snapshot t aligned by voxel positions.
- gid_tp1np.ndarray, shape (N,)
Grain IDs for snapshot t+1 aligned by voxel positions (same ordering as gid_t).
- idx_listlist[tuple[int,int,int]]
The ordered voxel_index list that defines the alignment.
- kanapy.texture.step2_overlap_counts(gid_t: ndarray, gid_tp1: ndarray, verbose: bool = True, log_fh=None)[source]
Step 2: Compute overlap counts C(g_t, g_tp1).
Parameters
- gid_t, gid_tp1np.ndarray, shape (N,)
Aligned grain-id arrays for snapshots t and t+1.
- verbosebool
If True, prints overlap statistics and match summaries.
Returns
- Cnp.ndarray, shape (Gt+1, Gtp1+1)
Overlap count matrix where C[i,j] = number of voxels shared.
- row_sumnp.ndarray
Total voxels per grain in t (row sums).
- col_sumnp.ndarray
Total voxels per grain in t+1 (col sums).
- top_pairslist[tuple]
Sorted list of (count, i, j) for the largest overlaps.
- kanapy.texture.step3_track_from_overlap(C, row_sum, col_sum, *, tau_parent=0.3, tau_child=0.3, allow_multi_parent=True, verbose: bool = True, log_fh=None)[source]
Build tracking relations from overlap matrix.
Returns
- parents_of_childdict[int, list[tuple[int, float, float, int]]]
child j -> list of (parent i, frac_of_parent, frac_of_child, count)
- best_parentdict[int, int]
child j -> parent i with max overlap
- best_childdict[int, int]
parent i -> child j with max overlap
- eventsdict[str, list]
merge/split/birth/death/continue records
- kanapy.texture.step4_assign_tracked_ids(pairs, C, row_sum, col_sum, events, parents_of_child, verbose: bool = True, log_fh=None)[source]
Step 4: Assign tracked grain IDs at t+1 using Hungarian matching and event logic.
Parameters
- pairslist of tuples
Each tuple is (count, grain_t, grain_t+1), sorted by overlap.
- Cnp.ndarray
Overlap matrix where C[i, j] is the count of voxels shared between grain i at t and grain j at t+1.
- row_sumnp.ndarray
Total voxel count per grain at t.
- col_sumnp.ndarray
Total voxel count per grain at t+1.
- eventsdict[str, list]
Event records from tracking: contains ‘split’, ‘merge’, ‘birth’, etc.
- parents_of_childdict[int, list[tuple]]
Mapping from child grain ID at t+1 to list of parent grain contributions from t.
- verbosebool, optional
Whether to print detailed summary and logs (default: True).
Returns
- final_idsdict[int, int]
Mapping of grain_id at t+1 → tracked global grain ID.
- kanapy.texture.step5_update_tracked_ids_in_json(json_path, t, final_ids, parents_of_child, verbose: bool = True, log_fh=None)[source]
Step 5: Update JSON file with new tracked grain IDs and parent relationships.
Parameters
- json_pathstr
Path to the microstructure JSON file.
- tint
Snapshot index to update (this modifies snapshot at t+1).
- final_idsdict[int, int]
Mapping of grain_id at t+1 to globally tracked IDs.
- parents_of_childdict[int, list[tuple]]
Mapping from child grain ID to parent grain info (from t).
- kanapy.texture.summarize_labels(label_array, rotations, wanted_labels=None)[source]
Summarize labeled pixels with average orientation and statistics
This function computes, for each label in label_array (or a subset of wanted_labels): - Number of pixels - Pixel indices - Average orientation vector - Standard deviation of orientation
Parameters
- label_arrayndarray of shape (H, W)
2D array of integer labels.
- rotationsndarray of shape (H*W, D)
Orientation data corresponding to each pixel (e.g., emap.rotations.data).
- wanted_labelssequence of int, optional
List of label IDs to summarize. If None, all labels in label_array are used.
Returns
- list of tuples
Each tuple is (label, info_dict) where info_dict contains: - ‘npix’ : int, number of pixels - ‘pixels’ : array of 1D indices in label_array.ravel() - ‘ori_av’ : ndarray of shape (D,), average orientation vector - ‘ori_std’ : ndarray of shape (D,), standard deviation of orientation
Notes
Uses np.add.reduceat and sorting for efficient computation
The returned list preserves the order of wanted_labels if provided, otherwise follows sorted unique labels from label_array
Does not modify input arrays
- kanapy.texture.texture_reconstruction(ns, ebsd=None, ebsdfile=None, orientations=None, grainsfile=None, grains=None, kernel=None, kernel_halfwidth=5, res_low=5, res_high=25, res_step=2, lim=5, hw_init=None, verbose=False)[source]
Reconstruct a reduced ODF from EBSD or orientation data
This function systematically reconstructs an orientation distribution function (ODF) using a given number of orientations or grains in a representative volume element (RVE). The reconstructed ODF approximates the misorientation distribution of the input data. Follows the method described in Biswas et al. (https://doi.org/10.1107/S1600576719017138).
Parameters
- nsint
Number of reduced orientations/grains in the RVE.
- ebsdEBSDmap, optional
EBSD map containing orientations for a single phase.
- ebsdfilestr, optional
Path to a *.mat file with EBSD data (not yet supported).
- orientationsOrientation, optional
Predefined orientations to use instead of EBSD data.
- grainsfilestr, optional
Path to estimated grains file (*.mat). Not used for kernel estimation.
- grainsobject, optional
Grain data. Not used for kernel estimation.
- kernelDeLaValleePoussinKernel, optional
Kernel for ODF estimation. Default: halfwidth=kernel_halfwidth.
- kernel_halfwidthfloat, optional
Halfwidth in degrees for default DeLaValleePoussin kernel. Default is 5°.
- res_lowfloat, optional
Minimum resolution (in degrees) of orientation grid for reconstruction. Default 5°.
- res_highfloat, optional
Maximum resolution (in degrees) of orientation grid. Default 25°.
- res_stepfloat, optional
Step size (in degrees) for grid resolution. Default 2°.
- limint, optional
Maximum number of consecutive worsening errors before stopping. Default 5.
- verbosebool, optional
If True, print progress and error information. Default False.
Returns
- orired_fOrientation
Reduced set of orientations in the fundamental region.
- odfred_fODF
Reconstructed ODF using the reduced orientations.
- erofloat
L1 error between reference ODF and reconstructed ODF.
- resfloat
Grid resolution (degrees) at which the minimum error was achieved.
Notes
Uses Monte Carlo sampling and kernel smoothing to generate reduced orientations.
Only supports single-phase EBSD data.
Kernel estimation from grains or files is not yet supported; default kernel is used.
The reconstructed ODF approximates the misorientation distribution of the input data.
- kanapy.texture.track_all_grains_across_snapshots(json_path: str, *, log_path: str | None = None, progress: bool = False, verbose: bool = True) None[source]
Run the full grain tracking pipeline across all snapshot pairs in the microstructure JSON.
Parameters
- json_pathstr
Path to the input JSON file containing microstructure data.
- kanapy.texture.visualize_graph(G, node_size=100, fs=12)[source]
Visualize a microstructure graph using a spring layout
This function draws the nodes and edges of the graph with labels, using a spring layout for positioning. Node color, edge color, node size, and font size can be adjusted.
Parameters
- Gnetworkx.Graph
Graph object representing the microstructure. Nodes should have meaningful labels.
- node_sizeint, optional
Size of the nodes in the plot. Default is 100.
- fsint, optional
Font size for node labels. Default is 12.
Notes
Uses NetworkX’s spring_layout for node positioning
Uses Matplotlib to render the plot
Does not modify the graph
Module plotting
Subroutines for plotting of microstructures
Created on Mon Oct 4 07:52:55 2021
@author: Alexander Hartmaier, Golsa Tolooei Eshlaghi, Ronak Shoghi, Yousef Rezek
- kanapy.core.plotting.plot_ellipsoids_3D(particles, cmap='prism', dual_phase=None, silent=False, asp_arr=None, phases=False, cols=None)[source]
Display ellipsoids after the packing procedure
Parameters
- particleslist
List of ellipsoid objects representing particles in the microstructure.
- cmapstr, optional
Color map for ellipsoids. Default is ‘prism’.
- dual_phasebool, optional
Deprecated. Use phases instead. If True, ellipsoids are colored according to phase (red/green contrast).
- silentbool, optional
If True, returns the figure object without displaying it. Default is False.
- asp_arrlist of 3 floats, optional
Aspect ratio for the 3D axes (x, y, z). Default is [1, 1, 1].
- phasesbool, optional
If True, ellipsoids are colored according to their phase number.
- colslist of str, optional
List of colors used for each phase when phases=True.
Returns
- figmatplotlib.figure.Figure, optional
The matplotlib figure object if silent=True.
Notes
The dual_phase parameter is deprecated. Use phases to control coloring by phase.
Each ellipsoid is represented by its surface mesh generated via surfacePointsGen method of the ellipsoid object.
- kanapy.core.plotting.plot_init_stats(stats_dict, gs_data=None, ar_data=None, gs_param=None, ar_param=None, save_files=False, silent=False)[source]
Plot initial microstructure descriptors (grain size and aspect ratio) based on user-defined statistics.
Parameters
- stats_dictdict
Dictionary containing initial microstructure statistics. Expected keys: - “Equivalent diameter”: dict with ‘sig’, ‘scale’, optionally ‘loc’, ‘cutoff_min’, ‘cutoff_max’ - “Aspect ratio”: dict with ‘sig’, ‘scale’, optionally ‘loc’, ‘cutoff_min’, ‘cutoff_max’ (for elongated grains) - “Grain type”: str, one of “Equiaxed”, “Elongated”, or “Free” - “Semi axes”: dict with ‘scale’, ‘sig’, ‘cutoff_min’, ‘cutoff_max’ (for free grains) - “Phase”: dict with ‘Number’ and ‘Name’, optional
- gs_dataarray-like, optional
Experimental equivalent diameter data. Default is None.
- ar_dataarray-like, optional
Experimental aspect ratio data. Default is None.
- gs_paramtuple, optional
Parameters (s, loc, scale, min, max) for lognormal distribution of experimental equivalent diameters. Default is None.
- ar_paramtuple, optional
Parameters (s, loc, scale, min, max) for lognormal distribution of experimental aspect ratios. Default is None.
- save_filesbool, optional
If True, save the figure to file “Input_distribution.png”. Default is False.
- silentbool, optional
If True, return the figure object instead of displaying it. Default is False.
Returns
- figmatplotlib.figure.Figure, optional
The figure object if silent=True.
Notes
- The function automatically selects plotting style depending on “Grain type”:
“Equiaxed”: only equivalent diameter distribution
“Elongated”: both equivalent diameter and aspect ratio distributions
“Free”: compute aspect ratio from semi-axes and rotation axis
Vertical dashed lines mark the minimum and maximum cut-offs from stats_dict.
Overlays experimental data (histogram) and lognormal fits if gs_data or ar_data are provided.
Uses lognormal PDFs for both grain size and aspect ratio.
- kanapy.core.plotting.plot_mean_ellipsoids_from_stats(stats_data: Mapping[str, Any], out_png: str | Path | None = 'figures/mean_ellipsoids_2panel.png', show: bool = True, nu: int = 90, nv: int = 50, wire_rstride: int = 3, wire_cstride: int = 3, axis_scale: float = 1.15)[source]
Plot mean ellipsoids (initial vs regridded) side-by-side from stats_data dict.
- Expects:
stats_data[“semi_axes”][“initial”][“a”|”b”|”c”] : list/array stats_data[“semi_axes”][“regridded”][“a”|”b”|”c”] : list/array
- Returns:
matplotlib.figure.Figure
- kanapy.core.plotting.plot_output_stats(data_list, labels, iphase=None, gs_data=None, gs_param=None, ar_data=None, ar_param=None, save_files=False, silent=False, enhanced_plot=False)[source]
Evaluate and plot particle- and RVE grain statistics, including equivalent diameters and aspect ratios
Parameters
- data_listlist of dict
List of dictionaries containing particle/grain statistics. Each dictionary should include keys like ‘eqd’, ‘eqd_scale’, ‘eqd_sig’, ‘ar’, ‘ar_scale’, ‘ar_sig’.
- labelslist of str
Labels indicating the type of data in data_list, e.g., [‘Grains’, ‘Partcls’].
- iphaseint, optional
Phase index to label the plots. Default is None.
- gs_dataarray-like, optional
Experimental equivalent diameter data for comparison. Default is None.
- gs_paramtuple, optional
Parameters for lognormal distribution of experimental data (s, loc, scale). Default is None.
- ar_dataarray-like, optional
Experimental aspect ratio data for comparison. Default is None.
- ar_paramtuple, optional
Parameters for lognormal distribution of experimental aspect ratio data (s, loc, scale). Default is None.
- save_filesbool, optional
If True, saves the generated figures as PNG files. Default is False.
- silentbool, optional
If True, returns the figure objects instead of showing them. Default is False.
- enhanced_plotbool, optional
If True, produces higher-resolution comparison plots using lognormal PDFs. Default is False.
Returns
- figmatplotlib.figure.Figure, optional
Figure object if silent=True.
Notes
The function can compare statistical distributions between grains, particles, and experimental data.
Both histograms and lognormal probability density functions are used to display distributions.
If enhanced_plot=True, PDFs for equivalent diameter and aspect ratio are plotted using a dense x-axis.
labels must contain at least ‘Grains’ or ‘Voxels’. Otherwise, a ValueError is raised.
- kanapy.core.plotting.plot_particles_3D(particles, cmap='prism', dual_phase=False, plot_hull=True, silent=False, asp_arr=None)[source]
Display inner polyhedra and optional hulls of ellipsoids after packing procedure
Parameters
- particleslist
List of ellipsoid objects containing inner polygons and convex hulls.
- cmapstr, optional
Colormap for ellipsoids. Default is ‘prism’.
- dual_phasebool, optional
If True, colors ellipsoids according to phase (red/green contrast).
- plot_hullbool, optional
If True, plots the outer hull of the ellipsoid. Default is True.
- silentbool, optional
If True, returns the figure object instead of displaying the plot.
- asp_arrlist of 3 floats, optional
Aspect ratio for the 3D axes (x, y, z). Default is [1, 1, 1].
Returns
- figmatplotlib.figure.Figure, optional
Matplotlib figure object if silent=True.
Notes
Each ellipsoid must have an inner polygon (pa.inner) to be plotted.
The convex hull of the ellipsoid is displayed using plot_trisurf.
If plot_hull is True, the outer surface of the ellipsoid is also plotted using plot_surface.
- kanapy.core.plotting.plot_polygons_3D(geometry, cmap='prism', alpha=0.4, ec=None, dual_phase=None, silent=False, asp_arr=None, phases=False, cols=None)[source]
Plot triangularized convex hulls of grains based on vertices and simplices
Parameters
- geometrydict
Dictionary containing grain geometry with keys: - ‘Grains’: dict with simplices (triangles) for each grain - ‘Points’: ndarray of vertex coordinates (N, 3)
- cmapstr, optional
Colormap for coloring the triangles. Default is ‘prism’.
- alphafloat, optional
Transparency of the polygons. Default is 0.4.
- eccolor or list, optional
Edge color for triangles. Default is [0.5, 0.5, 0.5, 0.1].
- dual_phasebool, optional
Deprecated. Use phases instead. If True, grains are colored by phase in red/green contrast.
- silentbool, optional
If True, returns the figure object instead of showing it. Default is False.
- asp_arrlist of 3 floats, optional
Aspect ratio for the 3D axes (x, y, z). Default is [1, 1, 1].
- phasesbool, optional
If True, colors grains according to their phase number.
- colslist of str, optional
Colors to use for each phase when phases=True.
Returns
- figmatplotlib.figure.Figure, optional
Matplotlib figure object if silent=True.
Notes
The dual_phase parameter is deprecated. Use phases to control coloring by phase.
Each grain is plotted using its convex hull triangles defined in geometry[‘Grains’][igr][‘Simplices’].
- kanapy.core.plotting.plot_stats(stats_data: Dict[str, Any], *, figsize: Tuple[float, float] = (18, 10), n_points_sa: int = 200, n_points_other: int = 500, show: bool = True) Figure[source]
Plot fitted lognormal PDFs for semi-axes (a,b,c), aspect ratio, and equivalent diameter for initial vs regridded microstructures.
Parameters
- stats_data
Dict with structure: - stats_data[‘semi_axes’][‘initial’/’regridded’] contains:
a,b,c arrays + {a,b,c}_sig + {a,b,c}_scale + xmin_gl + xmax_gl
stats_data[‘aspect’][‘initial’/’regridded’] contains: ar array + ar_sig + ar_scale + xmin_ar_i/xmax_ar_i + xmin_ar_r/xmax_ar_r
stats_data[‘eq_diam’][‘initial’/’regridded’] contains: eqd array + eqd_sig + eqd_scale + xmin_eq_i/xmax_eq_i + xmin_eq_r/xmax_eq_r
- figsize
Figure size (width, height).
- n_points_sa
Number of x samples for semi-axes PDFs.
- n_points_other
Number of x samples for aspect/eqd PDFs.
Returns
- fig
Matplotlib Figure object. Caller can save/show/close.
- kanapy.core.plotting.plot_stats_dict(sdict, title=None, save_files=False)[source]
Plot statistical data on semi-axes of effective ellipsoids in RVE as histogram
Parameters
- sdictdict
Dictionary containing semi-axis data and log-normal parameters. Keys should include ‘a’, ‘b’, ‘c’, and their corresponding ‘_sig’ and ‘_scale’.
- titlestr, optional
Title for the plot
- save_filesbool, optional
Whether to save the plot as PNG in the current working directory
- kanapy.core.plotting.plot_stats_overlay(stats_data: Dict[str, Any], *, label_initial: str = 'Initial', label_regridded: str = 'Regridded', figsize: Tuple[float, float] = (16, 11), n_points_sa: int = 300, n_points_other: int = 600, lw: float = 3.0, fill_sa: bool = True, alpha_sa_initial: float = 0.18, alpha_sa_regridded: float = 0.03, alpha_line_initial: float = 1.0, alpha_line_regridded: float = 0.3, fill_other: bool = True, alpha_other_initial: float = 0.12, alpha_other_regridded: float = 0.05, legend_fancybox: bool = True, legend_handlelength: float = 4.2, legend_handletextpad: float = 0.8, legend_borderpad: float = 0.6, show: bool = True) Figure[source]
Plot microstructure statistics as fitted lognormal PDFs with state overlays.
The function visualizes the distributions of (i) ellipsoidal semi-axes
a, b, c, (ii) aspect ratio, and (iii) equivalent diameter for two states (typically an initial microstructure and a processed/regridded snapshot). All curves are plotted as lognormal probability density functions (PDFs) using parameters stored instats_data.Semi-axes readability strategy
The semi-axes subplot overlays six curves (3 axes × 2 states). To keep the plot interpretable:
Color encodes the semi-axis component (
a,b,c).Line style encodes state (solid =
label_initial, dashed =label_regridded).Optional fills under the curves provide an additional separation cue:
alpha_sa_initialis stronger;alpha_sa_regriddedis intentionally small (nearly transparent).A single legend box is placed in the top-right corner with three rows (
a,b,c). Each row shows a tuple handle containing both the solid and dashed line samples for the same color. The legend uses rounded corners whenlegend_fancybox=True.
Parameters
- stats_datadict
Statistics container produced by your workflow (e.g.,
build_and_save_stats_data). Expected structure:stats_data["semi_axes"]["initial"|"regridded"]: { "a_sig", "a_scale", "b_sig", "b_scale", "c_sig", "c_scale", "xmin_gl", "xmax_gl", ... } stats_data["aspect"]["initial"|"regridded"]: { "ar_sig", "ar_scale", "xmin_ar_i"|"xmin_ar_r", "xmax_ar_i"|"xmax_ar_r", ... } stats_data["eq_diam"]["initial"|"regridded"]: { "eqd_sig", "eqd_scale", "xmin_eq_i"|"xmin_eq_r", "xmax_eq_i"|"xmax_eq_r", ... }
Only the lognormal parameters and x-range keys are required by this function.
- label_initialstr, optional
Display name for the initial state (used in titles/legends), by default
"Initial".- label_regriddedstr, optional
Display name for the second state (e.g.
"Regridded","Cold rolled"), by default"Regridded".- figsize(float, float), optional
Figure size in inches, by default
(16, 11).- n_points_saint, optional
Number of x-samples used to evaluate semi-axis PDFs, by default
300.- n_points_otherint, optional
Number of x-samples used to evaluate aspect ratio and equivalent diameter PDFs, by default
600.- lwfloat, optional
Line width for all curves, by default
3.0.- fill_sabool, optional
If True, fill under the semi-axis curves, by default True.
- alpha_sa_initialfloat, optional
Alpha (opacity) for the filled area under initial semi-axis curves. 0.0 is fully transparent and 1.0 is opaque, by default
0.18.- alpha_sa_regriddedfloat, optional
Alpha (opacity) for the filled area under regridded/processed semi-axis curves. Keep small (e.g. 0.0–0.05) to avoid clutter, by default
0.03.- alpha_line_initialfloat, optional
Alpha (opacity) for initial lines, by default
1.0.- alpha_line_regriddedfloat, optional
Alpha (opacity) for regridded/processed dashed lines, by default
0.30.- fill_otherbool, optional
If True, fill under aspect ratio and equivalent diameter curves, by default True.
- alpha_other_initialfloat, optional
Alpha for fills under initial aspect ratio / eq. diameter curves, by default
0.12.- alpha_other_regriddedfloat, optional
Alpha for fills under regridded/processed aspect ratio / eq. diameter curves, by default
0.05.- legend_fancyboxbool, optional
If True, use rounded legend corners, by default True.
- legend_handlelengthfloat, optional
Length of legend line samples. Increase this to make dashes more visible, by default
4.2.- legend_handletextpadfloat, optional
Spacing between handle and text in the legend, by default
0.8.- legend_borderpadfloat, optional
Padding inside the legend frame, by default
0.6.- showbool, optional
If True, calls
plt.show()before returning, by default True.
Returns
- matplotlib.figure.Figure
The generated Matplotlib figure. The caller may further customize, save, or close it.
Notes
Aspect ratio is dimensionless and is labeled as
(-).The x-ranges for each metric are chosen as the global min/max across both states to enable fair comparisons.
Examples
Basic usage with custom label for the second state:
fig = plot_stats_overlay(
    stats_data,
    label_regridded="Cold rolled",
    alpha_line_regridded=0.20,
    alpha_sa_regridded=0.01,
    legend_handlelength=5.0,
    show=True,
)
fig.savefig("figures/stats_overlay.png", dpi=250, bbox_inches="tight")
- kanapy.core.plotting.plot_voxels_3D(data, Ngr=None, sliced=False, dual_phase=None, mask=None, cmap='prism', alpha=1.0, silent=False, clist=None, asp_arr=None, phases=False, cols=None)[source]
Plot voxels in microstructure, each grain with a different color. Sliced indicates whether one eighth of the box should be removed to see internal structure. With alpha, the transparency of the grains can be adjusted.
Parameters
- dataint array
Grain number or phase number associated to each voxel
- Ngrint, optional
Number of grains. The default is 1.
- slicedBoolean, optional
Indicate if one eighth of box is invisible. The default is False.
- dual_phaseBoolean, optional
Indicate if microstructure is dual phase. The default is False.
- maskbool array, optional
Mask for voxels to be displayed. The default is None, in which case all voxels will be plotted (except sliced).
- cmapcolor map, optional
Color map for voxels. The default is ‘prism’.
- alphafloat, optional
Adjust transparency of voxels in alpha channel of color map. The default is 1.0.
- showbool
Indicate whether to show the plot or to return the axis for further use
- clist(Ngr, 3)-ndarray
List of RGB colors for each grain
Returns
- axmatplotlib.axes
Axes handle for 3D subplot
Module smoothing
- class kanapy.core.smoothingGB.Node(iden, px, py, pz)[source]
Bases:
objectClass representing a single node in 3D space with position, velocity, acceleration, and anchors
Parameters
- idenint
Identifier to assign to the node
- pxfloat
Initial x-coordinate of the node
- pyfloat
Initial y-coordinate of the node
- pzfloat
Initial z-coordinate of the node
Attributes
- idint
Unique identifier of the node
- px, py, pzfloat
Current x, y, z coordinates of the node
- oripx, oripy, oripzfloat
Original x, y, z coordinates of the node
- vx, vy, vzfloat
Velocity components along x, y, z
- ax, ay, azfloat
Acceleration components along x, y, z
- anchorslist
List of anchors connected to this node
Notes
This class represents a single node in 3D space, storing both its kinematic state (position, velocity, acceleration) and connections to anchors.
- compute_acc(fx, fy, fz, mass)[source]
Compute the acceleration of the node given applied forces and mass
Parameters
- fxfloat
Force component along x
- fyfloat
Force component along y
- fzfloat
Force component along z
- massfloat
Mass of the node
- get_Oripos()[source]
Return the original position of the node as a NumPy array
Returns
- oriposndarray
Array containing the original x, y, z coordinates of the node
- get_pos()[source]
Return the current position of the node as a NumPy array
Returns
- posndarray
Array containing the x, y, z coordinates of the node
- get_vel()[source]
Return the current velocity of the node as a NumPy array
Returns
- velndarray
Array containing the velocity components vx, vy, vz
- kanapy.core.smoothingGB.initalizeSystem(nodes_v, grain_facesDict)[source]
Initialize a spring-mass system from nodes and grain faces
Creates Node objects for all nodes, generates anchors at the center of each face, and links nodes to their associated anchors for the spring-mass system.
Parameters
- nodes_vndarray
Array of nodal coordinates with shape (Nnodes, 3)
- grain_facesDictdict
Dictionary mapping grain ID to a dictionary of outer faces, as returned by readGrainFaces
Returns
- allNodeslist of Node
List of Node objects with anchors assigned
- anchDictdict
Dictionary mapping face ID to anchor position (x, y, z)
- kanapy.core.smoothingGB.readGrainFaces(nodes_v, elmtDict, elmtSetDict)[source]
Extract outer faces of polyhedral grains from voxel connectivity
Constructs a dictionary of outer faces for each grain by analyzing voxel elements, excluding faces that lie on the boundary of the RVE.
Parameters
- nodes_vndarray
Array of nodal coordinates with shape (Nnodes, 3)
- elmtDictdict
Dictionary mapping element ID to its 8 node indices
- elmtSetDictdict
Dictionary mapping grain ID to a list of element IDs belonging to that grain
Returns
- grain_facesDictdict
Dictionary mapping grain ID to a dictionary of outer faces. Each face is stored as {face_id: [node1, node2, node3, node4]}.
- kanapy.core.smoothingGB.relaxSystem(allNodes, anchDict, dt, N, k, c, RVE_xmin, RVE_xmax, RVE_ymin, RVE_ymax, RVE_zmin, RVE_zmax)[source]
Relax the spring-mass system to reach equilibrium
Integrates the motion of nodes over N time steps with time step dt, considering spring forces to anchors and damping. Boundary nodes at RVE surfaces are fixed in the corresponding directions.
Parameters
- allNodeslist of Node
List of Node objects with positions, velocities, and anchors
- anchDictdict
Dictionary mapping face ID to anchor position (x, y, z)
- dtfloat
Time step for integration
- Nint
Number of integration steps
- kfloat
Spring stiffness
- cfloat
Damping coefficient
- RVE_xmin, RVE_xmaxfloat
Minimum and maximum x-coordinates of RVE boundary
- RVE_ymin, RVE_ymaxfloat
Minimum and maximum y-coordinates of RVE boundary
- RVE_zmin, RVE_zmaxfloat
Minimum and maximum z-coordinates of RVE boundary
Returns
- allNodeslist of Node
Updated list of Node objects after relaxation
- kanapy.core.smoothingGB.smoothingRoutine(nodes_v, elmtDict, elmtSetDict)[source]
Smooth a voxel-based microstructure by relaxing a spring-mass-anchor system
Constructs outer faces of grains, initializes nodes with anchors at face centers, and iteratively relaxes the system to reduce irregularities in node positions.
Parameters
- nodes_vndarray, shape (N_nodes, 3)
Coordinates of all nodes in the voxel mesh
- elmtDictdict
Dictionary mapping element ID to its node indices
- elmtSetDictdict
Dictionary mapping grain ID to the set of element IDs it contains
Returns
- nodes_sndarray, shape (N_nodes, 3)
Smoothed coordinates of all nodes
- grain_facesDictdict
Dictionary mapping grain ID to its outer faces and corresponding node connectivity